Undocumented Matlab
  • SERVICES
    • Consulting
    • Development
    • Training
    • Gallery
    • Testimonials
  • PRODUCTS
    • IQML: IQFeed-Matlab connector
    • IB-Matlab: InteractiveBrokers-Matlab connector
    • EODML: EODHistoricalData-Matlab connector
    • Webinars
  • BOOKS
    • Secrets of MATLAB-Java Programming
    • Accelerating MATLAB Performance
    • MATLAB Succinctly
  • ARTICLES
  • ABOUT
    • Policies
  • CONTACT

Undocumented plot marker types

March 13, 2019 One Comment

I wanted to take a break from my miniseries on the Matlab toolstrip to describe a nice little undocumented aspect of plot line markers. Plot line marker types have remained essentially unchanged in user-facing functionality for the past two+ decades, allowing the well-known marker types (.,+,o,^ etc.). Internally, lots of things changed in the graphics engine, particularly in the transition to HG2 in R2014b and the implementation of markers using OpenGL primitives. I suspect that during the massive amount of development work that was done at that time, important functionality improvements that were implemented in the engine were forgotten and did not percolate all the way up to the user-facing functions. I highlighted a few of these in the past, for example transparency and color gradient for plot lines and markers, or various aspects of contour plots.
Fortunately, Matlab usually exposes the internal objects that we can customize and which enable these extra features, in hidden properties of the top-level graphics handle. For example, the standard Matlab plot-line handle has a hidden property called MarkerHandle that we can access. This returns an internal object that enables marker transparency and color gradients. We can also use this object to set the marker style to a couple of formats that are not available in the top-level object:

>> x=1:10; y=10*x; hLine=plot(x,y,'o-'); box off; drawnow;
>> hLine.MarkerEdgeColor = 'r';
>> set(hLine, 'Marker')'  % top-level marker styles
ans =
  1×14 cell array
    {'+'} {'o'} {'*'} {'.'} {'x'} {'square'} {'diamond'} {'v'} {'^'} {'>'} {'<'} {'pentagram'} {'hexagram'} {'none'}
>> set(hLine.MarkerHandle, 'Style')'  % low-level marker styles
ans =
  1×16 cell array
    {'plus'} {'circle'} {'asterisk'} {'point'} {'x'} {'square'} {'diamond'} {'downtriangle'} {'triangle'} {'righttriangle'} {'lefttriangle'} {'pentagram'} {'hexagram'} {'vbar'} {'hbar'} {'none'}

>> x=1:10; y=10*x; hLine=plot(x,y,'o-'); box off; drawnow; >> hLine.MarkerEdgeColor = 'r'; >> set(hLine, 'Marker')' % top-level marker styles ans = 1×14 cell array {'+'} {'o'} {'*'} {'.'} {'x'} {'square'} {'diamond'} {'v'} {'^'} {'>'} {'<'} {'pentagram'} {'hexagram'} {'none'} >> set(hLine.MarkerHandle, 'Style')' % low-level marker styles ans = 1×16 cell array {'plus'} {'circle'} {'asterisk'} {'point'} {'x'} {'square'} {'diamond'} {'downtriangle'} {'triangle'} {'righttriangle'} {'lefttriangle'} {'pentagram'} {'hexagram'} {'vbar'} {'hbar'} {'none'}

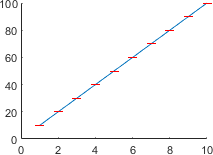
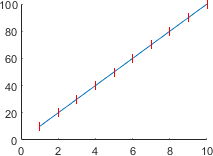
We see that the top-level marker styles directly correspond to the low-level styles, except for the low-level ‘vbar’ and ‘hbar’ styles. Perhaps the developers forgot to add these two styles to the top-level object in the enormous upheaval of HG2. Luckily, we can set the hbar/vbar styles directly, using the line’s MarkerHandle property:

hLine.MarkerHandle.Style = 'hbar';
set(hLine.MarkerHandle, 'Style','hbar');  % alternative

hLine.MarkerHandle.Style = 'hbar'; set(hLine.MarkerHandle, 'Style','hbar'); % alternative

hLine.MarkerHandle.Style='hbar'
hLine.MarkerHandle.Style='vbar'

USA visit

I will be travelling in the US in May/June 2019. Please let me know (altmany at gmail) if you would like to schedule a meeting or onsite visit for consulting/training, or perhaps just to explore the possibility of my professional assistance to your Matlab programming needs.

Related posts:

  1. Types of undocumented Matlab aspects – This article lists the different types of undocumented/unsupported/hidden aspects in Matlab...
  2. Undocumented scatter plot behavior – The scatter plot function has an undocumented behavior when plotting more than 100 points: it returns a single unified patch object handle, rather than a patch handle for each specific point as it returns with 100 or less points....
  3. Plot markers transparency and color gradient – Matlab plot-line markers can be customized to have transparency and color gradients. ...
  4. Undocumented scatter plot jitter – Matlab's scatter plot can automatically jitter data to enable better visualization of distribution density. ...
  5. Accessing hidden HG2 plot functionality – In HG2, some of the plot functionality is hidden in undocumented properties. ...
  6. Plot line transparency and color gradient – Static and interpolated (gradient) colors and transparency can be set for plot lines in HG2. ...
HG2 Hidden property Internal component Pure Matlab Undocumented feature
Print Print
« Previous
Next »
One Response
  1. Yaroslav March 14, 2019 at 14:44 Reply

    Maybe they couldn’t find a good shortcut. The natural one for hbar would be

    plot(x,y,'-');

    plot(x,y,'-');

    but it already has an interpretation (of a full line). Nonetheless, the shortcut might have been defined as

    plot(x,y,'_');

    plot(x,y,'_');

    I also don’t see any problem with the natural shortcut for vbar,

    plot(x,y,'|');

    plot(x,y,'|');

    In any case, it is a very useful feature that I will surely use in the future. Thanks, @Yair!

Leave a Reply
HTML tags such as <b> or <i> are accepted.
Wrap code fragments inside <pre lang="matlab"> tags, like this:
<pre lang="matlab">
a = magic(3);
disp(sum(a))
</pre>
I reserve the right to edit/delete comments (read the site policies).
Not all comments will be answered. You can always email me (altmany at gmail) for private consulting.

Click here to cancel reply.

Useful links
  •  Email Yair Altman
  •  Subscribe to new posts (feed)
  •  Subscribe to new posts (reader)
  •  Subscribe to comments (feed)
 
Accelerating MATLAB Performance book
Recent Posts

Speeding-up builtin Matlab functions – part 3

Improving graphics interactivity

Interesting Matlab puzzle – analysis

Interesting Matlab puzzle

Undocumented plot marker types

Matlab toolstrip – part 9 (popup figures)

Matlab toolstrip – part 8 (galleries)

Matlab toolstrip – part 7 (selection controls)

Matlab toolstrip – part 6 (complex controls)

Matlab toolstrip – part 5 (icons)

Matlab toolstrip – part 4 (control customization)

Reverting axes controls in figure toolbar

Matlab toolstrip – part 3 (basic customization)

Matlab toolstrip – part 2 (ToolGroup App)

Matlab toolstrip – part 1

Categories
  • Desktop (45)
  • Figure window (59)
  • Guest bloggers (65)
  • GUI (165)
  • Handle graphics (84)
  • Hidden property (42)
  • Icons (15)
  • Java (174)
  • Listeners (22)
  • Memory (16)
  • Mex (13)
  • Presumed future risk (394)
    • High risk of breaking in future versions (100)
    • Low risk of breaking in future versions (160)
    • Medium risk of breaking in future versions (136)
  • Public presentation (6)
  • Semi-documented feature (10)
  • Semi-documented function (35)
  • Stock Matlab function (140)
  • Toolbox (10)
  • UI controls (52)
  • Uncategorized (13)
  • Undocumented feature (217)
  • Undocumented function (37)
Tags
ActiveX (6) AppDesigner (9) Callbacks (31) Compiler (10) Desktop (38) Donn Shull (10) Editor (8) Figure (19) FindJObj (27) GUI (141) GUIDE (8) Handle graphics (78) HG2 (34) Hidden property (51) HTML (26) Icons (9) Internal component (39) Java (178) JavaFrame (20) JIDE (19) JMI (8) Listener (17) Malcolm Lidierth (8) MCOS (11) Memory (13) Menubar (9) Mex (14) Optical illusion (11) Performance (78) Profiler (9) Pure Matlab (187) schema (7) schema.class (8) schema.prop (18) Semi-documented feature (6) Semi-documented function (33) Toolbar (14) Toolstrip (13) uicontrol (37) uifigure (8) UIInspect (12) uitools (20) Undocumented feature (187) Undocumented function (37) Undocumented property (20)
Recent Comments
  • Nicholas (6 days 22 hours ago): Hi Yair, Thanks for the reply. I am on Windows 10. I also forgot to mention that this all works wonderfully out of the editor. It only fails once compiled. So, yes, I have tried a...
  • Nicholas (6 days 22 hours ago): Hi Yair, Thanks for the reply. I am on Windows 10. I also forgot to mention that this all works wonderfully out of the editor. It only fails once compiled. So, yes, I have tried a...
  • Yair Altman (7 days 5 hours ago): Nicholas – yes, I used it in a compiled Windows app using R2022b (no update). You didn’t specify the Matlab code location that threw the error so I can’t help...
  • Nicholas (8 days 1 hour ago): Hi Yair, Have you attempted your displayWebPage utility (or the LightweightHelpPanel in general) within a compiled application? It appears to fail in apps derived from both R2022b...
  • João Neves (11 days 6 hours ago): I am on matlab 2021a, this still works: url = struct(struct(struct(struct(hF ig).Controller).PlatformHost). CEF).URL; but the html document is empty. Is there still a way to do...
  • Yair Altman (14 days 5 hours ago): Perhaps the class() function could assist you. Or maybe just wrap different access methods in a try-catch so that if one method fails you could access the data using another...
  • Jeroen Boschma (14 days 7 hours ago): Never mind, the new UI components have an HTML panel available. Works for me…
  • Alexandre (14 days 8 hours ago): Hi, Is there a way to test if data dictionnatry entry are signal, simulink parameters, variables … I need to access their value, but the access method depends on the data...
  • Nicholas (14 days 22 hours ago): In case anyone is looking for more info on the toolbar: I ran into some problems creating a toolbar with the lightweight panel. Previously, the Browser Panel had an addToolbar...
  • Jeroen Boschma (18 days 5 hours ago): I do not seem to get the scrollbars (horizontal…) working in Matlab 2020b. Snippets of init-code (all based on Yair’s snippets on this site) handles.text_explorer...
  • Yair Altman (46 days 7 hours ago): m_map is a mapping tool, not even created by MathWorks and not part of the basic Matlab system. I have no idea why you think that the customizations to the builtin bar function...
  • chengji chen (46 days 14 hours ago): Hi, I have tried the method, but it didn’t work. I plot figure by m_map toolbox, the xticklabel will add to the yticklabel at the left-down corner, so I want to move down...
  • Yair Altman (54 days 7 hours ago): @Alexander – this is correct. Matlab stopped including sqlite4java in R2021b (it was still included in 21a). You can download the open-source sqlite4java project from...
  • Alexander Eder (60 days 2 hours ago): Unfortunately Matlab stopped shipping sqlite4java starting with R2021(b?)
  • K (66 days 13 hours ago): Is there a way to programmatically manage which figure gets placed where? Let’s say I have 5 figures docked, and I split it into 2 x 1, I want to place 3 specific figures on the...
Contact us
Captcha image for Custom Contact Forms plugin. You must type the numbers shown in the image
Undocumented Matlab © 2009 - Yair Altman
This website and Octahedron Ltd. are not affiliated with The MathWorks Inc.; MATLAB® is a registered trademark of The MathWorks Inc.
Scroll to top