Using linkaxes vs. linkprop
Posted By Yair Altman On July 22, 2015 | 8 Comments
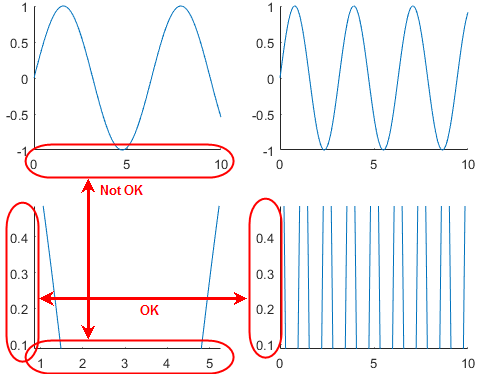
One of my clients recently asked me to solve a very peculiar problem: He had several axes and was using Matlab’s builtin linkaxes function to link their axis limits. However, it didn’t behave quite the way that he expected. His axes were laid out as 2×2 subplots, and he wanted the two columns to be independently linked in the X axis, and the two rows to be independently linked in the Y axis:
% Prepare the axes
ax(1,1) = subplot(2,2,1);
ax(1,2) = subplot(2,2,2);
ax(2,1) = subplot(2,2,3);
ax(2,2) = subplot(2,2,4);
% Plot something
x = 0 : 0.01 : 10;
line(x, sin(x),   'Parent',ax(1,1));
line(x, sin(2*x), 'Parent',ax(1,2));
line(x, cos(x),   'Parent',ax(2,1));
line(x, cos(5*x), 'Parent',ax(2,2));
% Link the relevant axes
linkaxes(ax(:,1),'x');  % left column
linkaxes(ax(:,2),'x');  % right column
linkaxes(ax(1,:),'y');  % top row
linkaxes(ax(2,:),'y');  % bottom row
The problem was that the plots didn’t behave as expected: when zooming in on the bottom-left axes, for example, only the bottom-right axes was updated (Y-limits synced), whereas the top-left axes’ X-limits remained unchanged:

Apparently, the second set of two linkaxes commands (to sync the rows’ Y-limits) overrode the first set of two linkaxes commands (to sync the columns’ X-limits).
Analysis
The reason for this unexpected behavior is that under the hood, linkaxes attaches property-change listeners to the corresponding axes, and stores these listeners in the axes’ hidden ApplicationData property (which is typically accessible via the getappdata / setappdata / isappdata / rmappdata set of functions). Specifically, up to a certain Matlab release (R2013b?), the listeners were placed in a field called ‘listener__’, and since then in a field called ‘graphics_linkaxes’. In either case, the field name was constant.
Therefore, when we placed the first set of linkaxes commands, the axes were correctly synced vertically (ax(1,1) with ax(2,1) in their X-limits, and similarly ax(1,2) with ax(2,2)). But when we placed the second set of linkaxes commands, the internal field in the axes’ ApplicationData property was overriden with the new listeners (that synced the rows’ Y-limits).
It so happens that Matlab listeners have a very nasty feature of being deleted when they are no longer referenced anywhere (within a workspace variable or object property). So when we overrode the first set of listener handles, we effectively deleted them, as if they were never set in the first place.
Some people may possibly complain about both issues at this point:
- That Matlab listeners get deleted so easily without so much as a console warning, and certainly against naive intuition.
- That repeated calls to linkaxes should override (rather than complement) each other.
As a side note, the addlistener function creates a listener and then persists it in the object’s hidden AutoListeners__ property. However, unlike the linkaxes behavior, addlistener‘s listener handles are always appended to AutoListeners__‘s contents, rather than replacing it. This ensures that all listeners are accessible and active until their container is deleted or they are specifically modified/removed. I wish that linkaxes used this mechanism, rather than its current ApplicationData one.
Workaround: linkprop
Luckily, there is a very easy and simple workaround, namely to use linkprop rather than linkaxes. The linkprop function is a lower-level function that creates a property-change listener that syncs corresponding properties in any specified array of object handles. In fact, linkaxes uses linkprop in order to create the necessary listeners. In our case, we can use linkprop directly, to independently attach such listeners to the axes’ XLim and YLim properties. We just need to ensure that all these listeners remain accessible to Matlab throughout the corresponding objects’ life-cycle. This is easily done using ApplicationData, as is done by linkaxes.m but in a smarter manner that does not override the previous values. The benefit of this is that when the axes are deleted, then so are the listeners; as long as the axes are accessible then so are the listeners. We just need to ensure that we don’t override these listener values:
setappdata(ax(1,1), 'YLim_listeners', linkprop(ax(1,:),'YLim'));
setappdata(ax(2,1), 'YLim_listeners', linkprop(ax(2,:),'YLim'));
setappdata(ax(1,1), 'XLim_listeners', linkprop(ax(:,1),'XLim'));
setappdata(ax(1,2), 'XLim_listeners', linkprop(ax(:,2),'XLim'));
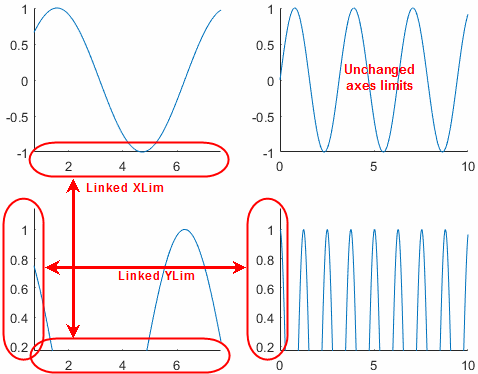
This results in the expected behavior:

Conclusions
The design decision by MathWorks to automatically delete Matlab listeners as soon as their reference count is zeroed and they get garbage-collected, causes a myriad of unexpected run-time behaviors, one of which is exemplified in today’s post on linkaxes. This would still have not caused any problem had the developers of linkaxes been aware of this listener feature and taken care to store the linked listener handles in an accumulating repository (e.g., adding the listener handle to an array of existing handles, rather than replacing a scalar handle).
Luckily, now that we know how Matlab listeners behave, we can easily identify abnormal behavior that results from listener handles going out of scope, and can easily take steps to persist the handles somewhere, so that they will remain active.
I wish to stress here that the listeners’ limited scope is fully documented in several places in the documentation (e.g., here [1] as well as the linkprop doc page [2]). The non-additive behavior of linkaxes is also documented, albeit in an almost-invisible footnote [3] on its doc-page.
However, I humbly contend that the fact that these behaviors are documented doesn’t meant that they are correct. After all, figure windows or timers aren’t deleted when their handle goes out of scope, are they? At the very least, I hope that MathWorks will improve the relevant doc pages, to highlight these non-intuitive behaviors, and in the case of linkaxes to present a linkprop usage example as a workaround.
If you are interested in the topic of Matlab listeners, note that I’ve written quite a few listener-related posts over the years (about property-change listeners as well as event listeners). I urge you to take a look at the list of related articles presented below, or to use the search box at the top of the page.
Categories: Handle graphics, Hidden property, Listeners, Low risk of breaking in future versions, Stock Matlab function, Undocumented feature
8 Comments (Open | Close)
Article printed from Undocumented Matlab: https://undocumentedmatlab.com
URL to article: https://undocumentedmatlab.com/articles/using-linkaxes-vs-linkprop
URLs in this post:
[1] here: http://www.mathworks.com/help/matlab/matlab_oop/listener-lifecycle.html#brc3z4h
[2] linkprop doc page: http://www.mathworks.com/help/matlab/ref/linkprop.html#zmw57dd0e386862
[3] almost-invisible footnote: http://www.mathworks.com/help/matlab/ref/linkaxes.html#moreabout
[4] Property value change listeners : https://undocumentedmatlab.com/articles/property-value-change-listeners
[5] Determining axes zoom state : https://undocumentedmatlab.com/articles/determining-axes-zoom-state
[6] Plot legend title : https://undocumentedmatlab.com/articles/plot-legend-title
[7] Plot performance : https://undocumentedmatlab.com/articles/plot-performance
[8] Multi-column (grid) legend : https://undocumentedmatlab.com/articles/multi-column-grid-legend
[9] FIG files format : https://undocumentedmatlab.com/articles/fig-files-format
Click here to print.
8 Comments To "Using linkaxes vs. linkprop"
#1 Comment By Yaroslav On July 24, 2015 @ 05:48
Hi @Yair,
The solution you proposed with
linkprophas a small issue: it does not restore the linking after saving and reloading. On the other hand,linkaxesrecovers its linking correctly.A simple workaround is to use Matlab’s own solution: “MCOS graphics cannot rely on custom machinery in hgload to restore linkaxes. Instead, create a matlab.graphics.internal.LinkAxes to wrap the linkprop which will restore the linkaxes when it is de-serialized.” In simple words,
% Link the relevant axes
restorable_linkprop = @(varargin)matlab.graphics.internal.LinkAxes(linkprop(varargin{:}));
%
setappdata(ax(1,1), 'YLim_listeners', restorable_linkprop(ax(1,:),'YLim'));
setappdata(ax(2,1), 'YLim_listeners', restorable_linkprop(ax(2,:),'YLim'));
setappdata(ax(1,1), 'XLim_listeners', restorable_linkprop(ax(:,1),'XLim'));
setappdata(ax(1,2), 'XLim_listeners', restorable_linkprop(ax(:,2),'XLim'));
#2 Comment By Amin On February 26, 2016 @ 18:50
Amazing post Yair. Thanks!
One question though. Is it possible to link two different properties? For example ‘x-axis’ of an ax to ‘x-axis’ and ‘y-axis’ of another ax?
#3 Comment By Yair Altman On February 27, 2016 @ 18:42
@Amin – I believe that you can link multiple properties/handles for example:
linkprop([hAxes1,hAxes2], {'XLim','YLim'})aught to link hAxes1.XLim to hAxes2.YLim
#4 Comment By Yaroslav On March 1, 2016 @ 08:43
@Yair — I am afraid that your solution doesn’t answer @Amin’s question. It, actually, behaves almost exactly as
@Amin — If you want to link two different properties, you must specify the listeners explicitly. For example,
The
linkpropfunction won’t do, since it links the same property between two different handle objects.#5 Comment By Yair Altman On March 1, 2016 @ 09:58
@Yaroslav – you are correct, I was misled by the wording of linkprop‘s documentation:
Serves me right to trust the builtin documentation! – I should have known better… 🙂
#6 Comment By Mark D. On August 8, 2018 @ 14:53
@Yaroslav your solution works great, but the double mouseclick (of zoom out or zoom in), which puts the plot in the default optimized axes, doesn’t work or behaves the same, instead of just linking by linkaxes. Do you know the solution for that too?
#7 Comment By Yaroslav On August 9, 2018 @ 10:52
@Mark, the
zoomfunction callsresetplotview(undocumented). It, in turn, resets all modes (X/YLimMode) toauto. That is why the listeners do not trigger.To solve the issue, link these properties too:
linkprop([a1 a2],{'XLimMode','YLimMode'}); % trigger linking on double click#8 Comment By Gabriel On December 21, 2021 @ 17:58
This didn’t work when trying to link y axes across the plots in each column and x axes across the plots in each row on an (m x n)
tiledlayout.On matlab R2021a found that I had to mix
linkaxesandsetappdata, like this:f = figure; m = 2; n = 3; tiles = tiledlayout(f, m, n); for i = 1:m %rows for j = 1:n %cols ax(i,j) = nexttile; plot(linspace(0,1,10)*i, linspace(2,1,10)*j); linkaxes(ax(:,j), 'y'); setappdata(ax(i,j), 'XLim_listeners', linkprop(ax(i,:),'XLim')); %using linkaxes(ax(i, :), 'x'); end % for all cols end % for all rows