A while ago I posted the first of my planned miniseries on the Matlab toolstrip (ribbon). Today I will expand that post by discussing how toolstrips can be added to Matlab GUIs. This post will remain at a high-level as the previous post, with followup posts drilling into the technical details of the toolstrip components (inner packages and classes).
We can add a Matlab toolstrip to 3 types of Matlab GUI windows:
- To a Java-based Matlab figure (so-called “legacy” figures, created using GUIDE or the figure function)
- To a container window of docked Java-based figures, typically called an “App” (marketing name) or “Tool Group” (internal technical name)
- To a JavaScript/HTML-based Matlab figure (so called “web” figures, created using App Designer or the uifigure function)
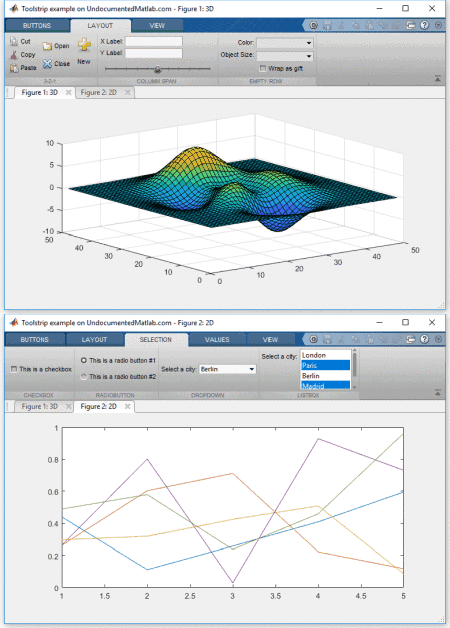
Today I will show how to add a basic dynamic toolstrip to a ToolGroup (App, window type #2):

ToolGroup with clients and dynamic toolstrip
Figure containers (“Tool Groups”)
Most Matlab users are familiar with window types #1 and #3 (legacy and web-based figures), but type #2 may seem strange. In fact, it shouldn’t be: All the Matlab “Apps” and Desktop components use such a container of docked clients. For example, both the Matlab Editor and Desktop are containers of individual client windows (individual files in the Editor; Command Window, Workspace etc. in the desktop).
Similarly, when we dock figures, they dock as client windows into a container called “Figures” (this can be controlled programmatically: see my setFigDockGroup utility on the File Exchange). This is the basis for all Matlab “Apps”, as far as I am aware (some Apps may possibly use a different GUI container, after all there are ~100 Matlab Apps and I’m not familiar with all of them). Such Apps are basically stand-alone Tool Groups (client container windows) that contain one or more docked figures, a toolstrip, and a side-panel with controls (so-called “Data Browser”).
Note: MathWorks uses confusing terminology here, using the same term “App” for both MathWorks-created GUIs containers (that have toolstrips, Data Browser and docked figures) and also user-created utilities on the File Exchange (that do not have these). Unfortunately, MathWorks has chosen not [yet] to release to the general public its set of tools that enable creating true “Apps”, i.e. those that have a toolstrip, Data Browser and docked figures.
Today’s post will attempt to fill this gap, by showing how we can create user Apps that have a toolstrip and docked figures. I will ignore the Data Browser today, and will describe it in a future post. Since docking figures into a standalone user-created container is a solved problem (using my setFigDockGroup utility), this post will focus on adding a toolstrip to such a container.
A ToolGroup object (matlab.ui.internal.desktop.ToolGroup) is created either implicitly (by docking a figure into a group that has a new name), or explicitly (by invoking its constructor):
% Create a new non-visible empty App (Tool Group)
hToolGroup = matlab.ui.internal.desktop.ToolGroup('Toolstrip example on UndocumentedMatlab.com');
Some things only work properly after the app is displayed, so let’s display the ToolGroup (however, note that for improved performance it is better to do whatever customizations and GUI updates that you can before the app is made visible):
% Display the ToolGroup window
hToolGroup.open();

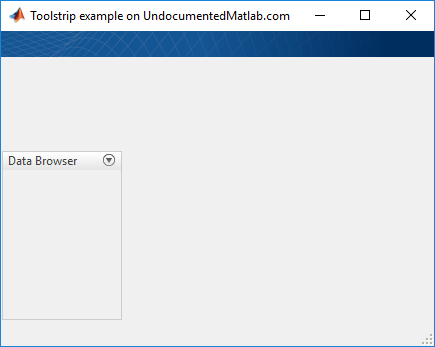
Basic empty ToolGroup (without toolstrip or clients)
An annoying quirk with ToolGroups is that they automatically close when their reference handle is deleted from Matlab memory. The specific behavior changes depending on the contents of the container and the Matlab release, but in general it’s safest to preserve the hToolGroup variable, to prevent the window from closing, when this variable goes out of scope, when the function (in which we create the ToolGroup) returns. There are many ways to persist this variable. Here’s one alternative, in which we persist it in itself (or rather, attached to its internal Java peer control):
% Store toolgroup reference handle so that app will stay in memory
jToolGroup = hToolGroup.Peer;
internal.setJavaCustomData(jToolGroup, hToolGroup);
internal.setJavaCustomData is an undocumented Matlab function that adds a new custom property to a Java reference handle. In our case, it adds a CustomData property to the jToolGroup handle and sets its value to the Matlab hToolGroup handle. The source code for internal.setJavaCustomData is available in %matlabroot%/toolbox/shared/controllib/general/+internal/setJavaCustomData.m and is very simple: it essentially uses the old schema-based schema.prop method for adding new properties to handles. Schema is an old deprecated mechanism that is mostly replaced by the newer MCOS (Matlab Class Object System), but for some specific cases such as this it’s still very useful (the standard addprop function can add new properties to Matlab GUI handles, but not to Java reference handles).
Finally, let’s discard the Data Browser side panel (I’ll discuss it in a separate future post):
% Discard the Data-browser left panel
hToolGroup.disableDataBrowser();
Adding a toolstrip to the ToolGroup
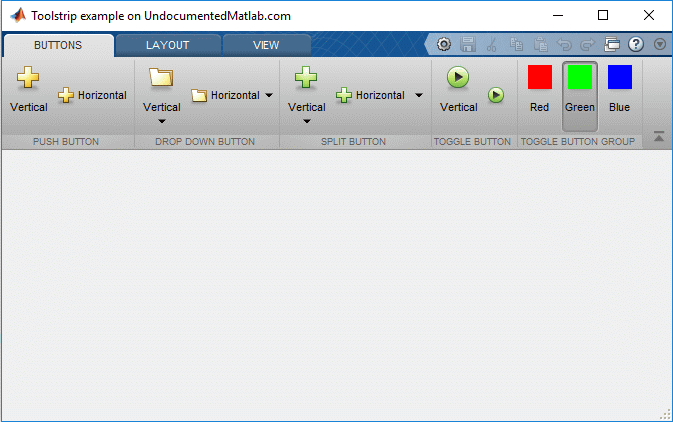
Now that we have the basic container ready, let’s add a toolstrip. To simplify matters in this introductory post (after all, I have still not described the internal packages and classes that make up a toolstrip), we’ll use some of the tabs used in the showcaseToolGroup example that I discussed in my previous post. You can see the relevant source code in %matlabroot%/toolbox/matlab/toolstrip/+matlab/+ui/+internal/+desktop/*.m, in case you want to jump ahead and customize your own toolstrip tabs, groups and buttons. In the code snippet below, we first create an empty TabGroup, then add toolstrip tabs into it, and finally add this TabGroup into our ToolGroup using its addTabGroup(hTabGroup) method:
% Create a new tab group
%hTabGroup = matlab.ui.internal.desktop.showcaseBuildTabGroup('swing');
hTabGroup = matlab.ui.internal.toolstrip.TabGroup();
hTab1 = matlab.ui.internal.desktop.showcaseBuildTab_Buttons('swing');
hTabGroup.add(hTab1);
%hTabGroup.add(matlab.ui.internal.desktop.showcaseBuildTab_Gallery());
hTabGroup.add(matlab.ui.internal.desktop.showcaseBuildTab_Layout('swing'));

% Select tab #1 (common)
hTabGroup.SelectedTab = hTab1;

% Add the tab group to the built-in toolstrip
hToolGroup.addTabGroup(hTabGroup);
We now have an “App” that has a toolstrip, but no clients (yet), and a hidden Data Browser side-panel:

Now let’s add some clients (docked figures):
Adding clients (docked figures) to the ToolGroup
There are two easy variants for adding docked figures in a ToolGroup: The easiest is to use the ToolGroup’s addFigure(hFigure) method:
% Create a figure and dock it into the tool-group
hFig1 = figure('Name','3D');
surf(peaks);
hToolGroup.addFigure(hFig1);
The second variant enables to dock a figure that has a specific set of toolstrip tabs attached to it. These tabs will only display in the toolstrip when that particular figure has focus. We do this by creating a new TabGroup (just as we have done above), and then add the figure and TabGroup to the container using the ToolGroup’s addClientTabGroup(hFigure,hTabGroup) method:
% Create the 2nd figure
hFig2 = figure('Name','2D');
plot(rand(5)); drawnow

% Add a few tabs that are only relevant to this specific figure
hTabGroup2 = matlab.ui.internal.toolstrip.TabGroup();
hTab2 = matlab.ui.internal.desktop.showcaseBuildTab_Selections();
hTabGroup2.add(hTab2);
hTabGroup2.add(matlab.ui.internal.desktop.showcaseBuildTab_EditValue());

% Add the figure and tabs to the ToolGroup
hToolGroup.addClientTabGroup(hFig2, hTabGroup2);

ToolGroup with clients and dynamic toolstrip
In this example, the “Selection” and “Values” toolstrip tabs only appear when the 2nd figure (“2D”) has focus. A similar behavior exists in the Matlab Desktop and Editor, where some tabs are only shown when certain clients have focus.
Removing the View tab
Note that the “View” toolstrip tab (which enables setting the appearance of the docked figures: layout, tab positions (top/bottom/left/right), ordering etc.) is automatically added to the toolstrip and always appears last. We can remove this View tab using the ToolGroup’s hideViewTab() method. The tab will not immediately be removed, only when the toolstrip is repainted, for example, when we switch focus between the docked figures:
hToolGroup.hideViewTab;  % toolstrip View tab is still visible at this point
figure(hFig1);  % change focus to hFig1 - toolstrip is repainted without View tab
Conclusion
It’s relatively easy to dock figures into a standalone “App” window that has a custom toolstrip, which can even be dynamically modified based on the figure which is currently in focus. Naturally, this has little benefit if we cannot customize the toolstrip components: labels, icons, control type, grouping and most importantly – callbacks. This topic deserves a dedicated post, which I plan to be the next in this miniseries. Stay tuned – hopefully the next post will not take me as long to publish as this post (I was quite busy recently)…


 One thing with the modified code is that it is necessary to add an attachment to send an...
Hi Yair,
“hTabGroup2 = TabGroup();” in section “Adding clients (docked figures) to the ToolGroup” should be
“hTabGroup2 = matlab.ui.internal.toolstrip.TabGroup();”
Greetings Alex
@Alex – thanks, fixed
Hi, Yair
Thanks for your introduction of this toolstrip. if this toolstrip can be deploy as a standalone application, it will be amazing.
it is success to deploy the ToolGroupApp.exe (save all your commands as ToolGroupApp.m and ‘mcc -m ToolGroupApp’), but when running it, the two figures will jump out as two windows, not dock as two cilents in the toolgroup.
is it possible to solve this problem, so that the wonderful toolstrip can demploy as a exe with beatuiful user interface?
looking forward to your reply
best
Henry
@Henry – for some unknown reason, MathWorks have chosen to intentionally prevent figure docking in compiled applications. There used to be a workaround for this, but it is no longer working (in other words, MathWorks have closed the loophole) in recent Matlab releases.
Hi Yair
Thanks for your answer. Maybe MATHWORKS want to prevent their own APPs in the matlab. If they can be deployed, all the Apps can be used without license. But it is very pity, otherwise, matlab can build very wonderful apps to users.
Hello Yair,
minor correction (on the part you recently corrected, sorry):
Other than that great article. Just a note, for MATLAB R2016a, the “addClientTabGroup” method to add a specific tab linked with a figure has to be called after the figure is attached, so for this version the code becomes:
Everything works fine after that.
@Tanguy – thanks for the typo correction, now fixed.
Hi, thanks for your good information,
I have a question here:
how can we set a specific initial view model?
For example, I want to plot step resp. and impulse resp. together in one window (as we have “left/right” in the view tab).
@Arash – I plan to discuss client layups in a future post of this mini-series. In the meantime you can play with this:
Thanks for writing this series, I’ve found using the ToolGroup very enjoyable in new lightweight apps. One issue/annoyance I’ve noticed is that conditional tab groups (using the
addClientTabGroup()method) will remove and re-add themselves every time a new figure is selected that uses the tab group. This creates a “flashing” effect as the view is rendered during the removal and addition process. For reference, I’m using Matlab R2016b. Is this a unique issue, or are other people seeing the same effects?Is there any way to display “Figure’s default Toolbar” when docked to “ToolGroup”? as it does when you use Matlab’s default docking option.