In the previous post I showed how we can create custom Matlab apps. In such apps, the toolstrip is very often an important part. Today I continue my miniseries on toolstrips. Toolstrips can be a bit complex so I’m trying to proceed slowly, with each post in the miniseries building on the previous posts. So I encourage you to review the earlier posts in the miniseries (part1, part2) before reading this post.
A Matlab toolstrip is composed of a hierarchy of user-interface objects as follows (all objects are classes within the matlab.ui.internal.toolstrip package):
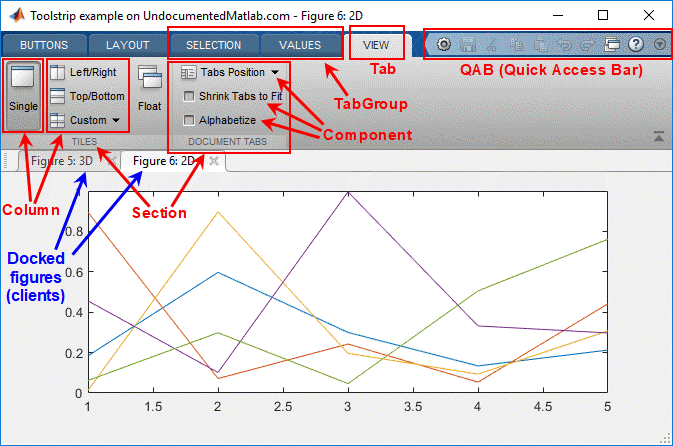
Anatomy of a Matlab app with toolstrip
- TabGroup
- Tab
- Section
- Column
- Component
- Component
- …
- Component
- Column
- …
- Column
- Section
- …
- Section
- Tab
- …
- Tab
- TabGroup
- …
In this post I explain how we can create a custom toolstrip that contains tabs, sections, and basic controls that interact with the user and the docked figures. The following posts will show more advanced customizations and more complex controls, as well as showing alternative ways of creating the toolstrip.
1. Creating a bare toolstrip and new tabs
We start with a new ToolGroup that has a bare toolstrip and a docked figure (for details and explanations refer to the previous post):
% Create a new ToolGroup ("app") with a hidden DataBrowser
hToolGroup = matlab.ui.internal.desktop.ToolGroup('Toolstrip example on UndocumentedMatlab.com');
hToolGroup.disableDataBrowser();
hToolGroup.open();  % this may be postponed further down for improved performance

% Store toolgroup reference handle so that app will stay in memory
jToolGroup = hToolGroup.Peer;
internal.setJavaCustomData(jToolGroup, hToolGroup);

% Create two figures and dock them into the ToolGroup
hFig1 = figure('Name','3D');  surf(peaks);
hToolGroup.addFigure(hFig1);
We now create a new TabGroup and and it to our ToolGroup:
import matlab.ui.internal.toolstrip.*  % for convenience below
hTabGroup = TabGroup();
hToolGroup.addTabGroup(hTabGroup);
We can add a new Tab to the TabGroup using either of two methods:
- Create a new
Tabobject and then useTabGroup.add(hTab,index)to add it to a parentTabGroup. The index argument is optional – if specified the section is inserted at that index location; if not, it is added at the end of the tab-group. Sample usage:hTab = Tab('Data'); hTabGroup.add(hTab); % add to tab as the last section hTabGroup.add(hTab,3); % add to tab as the 3rd section
- Call
TabGroup.addTab(title). This creates a new tab with the specified title (default: ”) and adds it at the end of the tab-group. The new tab’s handle is returned by the function. Sample usage:hTabGroup.addTab('Data'); % add to tab-group as the last tab
This creates an empty “Data” tab in our app toolstrip. Note that the tab title is capitalized (“DATA”), despite the fact that we set its Title property to 'Data'. Also note that while the tab’s Title property can be updated after the tab is created, in practice the tab title does not seem to change.
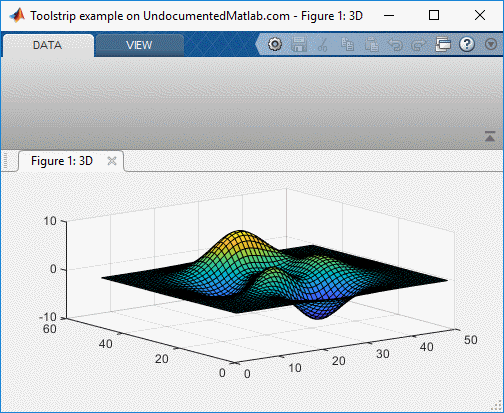
Lastly, note that a “VIEW” tab is automatically added to our toolstrip. As explained in the previous post, we can remove it using hToolGroup.hideViewTab; (refer to the previous post for details).
2. Adding sections to a toolstrip tab
Each toolstrip Tab is composed of Sections, that holds the actual components. We cannot add components directly to a Tab: they have to be contained within a Section. A toolstrip Tab can only contain Sections as direct children.
We can add a new section to a Tab using either of two methods, in a similar way to the that way we added a new tab above:
- Create a new
Sectionobject and then useTab.add(hSection,index)to add it to a parentTab. The index argument is optional – if specified the section is inserted at that index location; if not, it is added at the end of the tab. Sample usage:hSection = Section('Section title'); hTab.add(hSection); % add to tab as the last section hTab.add(hSection,3); % add to tab as the 3rd section
- Call
Tab.addSection(title). This creates a new section with the specified title (default: ”) and adds it at the end of the tab. The new section’s handle is returned by the function. Sample usage:hTab.addSection('Section title'); % add to tab as the last section
Note that the help section for Tab.addSection() indicates that it’s possible to specify 2 string input args (presumably Title and Tag), but this is in fact wrong and causes a run-time error, since Section constructor only accepts a single argument (Title), at least as of R2018b.
The Section‘s Title property can be set both in the constructor, as well as updated later. In addition, we can also set the Tag and CollapsePriority properties after the section object is created (these properties cannot be set in the constructor call):
hSection.Title = 'New title';    % can also be set in constructor call
hSection.Tag = 'section #1';     % cannot be set in constructor call
hSection.CollapsePriority = 10;  % cannot be set in constructor call
The CollapsePriority property is responsible for controlling the order in which sections and their internal components collapse into a drop-down when the window is resized to a smaller width.
Like tabs, section titles also appear capitalized. However, unlike the section titles can indeed be modified in run-time.
3. Adding columns to a tab section
Each Section in a toolstrip Tab is composed of Columns, and each Column can contain 1-3 Components. This is a very effective layout for toolstrip controls that answers the vast majority of use-cases. In some special cases we might need more flexibility with the component layout within a Tab – I will explain this in a future post. But for now let’s stick to the standard Tab-Section-Column-Component framework.
We can add columns to a section using (guess what?) either of two methods, as above:
- Create a new
Columnobject and then useSection.add(hColumn,index)to add it to a parentSection. The index argument is optional – if specified the column is inserted at that index location; if not, it is added at the end of the section. Sample usage:hColumn = Column('HorizontalAlignment','center', 'Width',150); hSection.add(hColumn); % add to section as the last column hSection.add(hColumn,3); % add to section as the 3rd column
- Call
Tab.addSection(title). This creates a new section with the specified title (default: ”) and adds it at the end of the tab. The new section’s handle is returned by the function. Sample usage:hSection.addColumn('HorizontalAlignment','center', 'Width',150); % add to section as the last column
We can set the Column‘s HorizontalAlignment and Width properties only in the constructor call, not later via direct assignments. In contrast, the Tag property cannot be set in the constructor, only via direct assignment:
hColumn.HorizontalAlignment = 'right';  % error: can only be set via constructor call: Column('HorizontalAlignment','right', ...)
hColumn.Width = 150;                    % error: can only be set via constructor call: Column('Width',150, ...)
hColumn.Tag = 'column #2';              % ok: cannot be set via the constructor call!
This is indeed confusing and non-intuitive. Perhaps this is part of the reason that the toolstrip API is still not considered stable enough for a general documented release.
4. Adding controls to a section column
Each section column contains 1 or more Components. These can be push/toggle/split/radio buttons, checkboxes, drop-downs, sliders, spinners, lists etc. Take a look at matlabroot%/toolbox/matlab/toolstrip/+matlab/+ui/+internal/+toolstrip/ for a full list of available controls. I’ll discuss a few basic controls in this post, and more complex ones in future posts.
As above, there are two methods for adding components to a section column, but they have different purposes:
Column.addEmptyControl()adds a filler space in the next position of the column. This is used to display the colorbar control at the center of the column in the usage snippet below.- Create a new
Componentobject and then useColumn.add(hComponent, index)to add it to a parentColumn. The index argument is optional – if specified the component is inserted at that index location; if not, it is added at the end of the column. Sample usage:hButton = Button('Click me!'); hColumn.add(hButton); % add to column as the last component hColumn.add(hButton,3); % add to column as the 3rd component
Component objects (matlab.ui.internal.toolstrip.base.Component, which all usable toolstrip controls inherit) have several common properties. Leaving aside the more complex components for now, most usable controls include the following properties:
- Text – text label, displayed next to the control icon (pity that MathWorks didn’t call this property String or Label, in line with uicontrols/menu-items)
- Description – tooltip, displayed when hovering the mouse over the control (pity that MathWorks didn’t call this property Tooltip in line with uicontrols/menu-items)
- Tag – a string, as all other Matlab HG objects. Controls are searchable by their Tag via their container’s find(tag) and findAll(tag) methods (again, I don’t quite understand why not use findobj and findall as with the rest of Matlab HG…).
- Enabled – a logical value (
true/false),trueby default - Icon – the icon used next to the Text label. We can use the
Iconconstructor (that expects the full path of a PNG/JPG file), or one of its static icons (e.g. Icon.REFRESH_16). Icons will be discussed in detail in the following post; in the meantime you can see various usage examples below.
Each control also has one or more callbacks that can be specified, as settable properties and/or as events that can be listened-to using the addlistener function. This too will be discussed in detail in the next post, but in the meantime you can see various usage examples below.
Columns can have 1-3 components:
- If only 1 component is specified, it is allocated the full column height, effectively creating a large control, with the Icon on top (typically a 24×24 icon) and the Text label beneath.
- If 2 or 3 components are specified, then smaller controls are displayed, with the Text label to the right of the Icon (typically 16×16), and the controls evenly spaced within the column.
- If you try to add more than 3 components to a
Column, you’ll get a run-time error.
5. Usage example
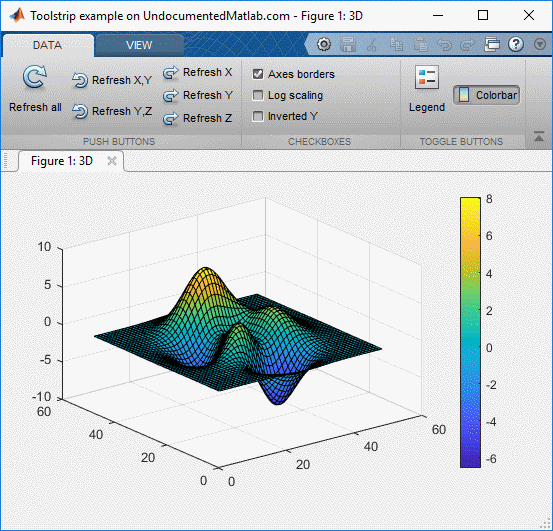
Here is a short usage example showing the above concepts. The code is not pretty by any means – I intentionally wanted to display multiple different ways of adding components, specifying properties and callbacks etc. It is meant merely as an educational tool, and is not close to being ready for production code. So please don’t complain about the known fact that the code is ugly, non-robust, and in general exhibits bad programming practices. The complete runnable code can be downloaded here.
The following code snippets assume that you have already ran the code in paragraph 1 above:
Push-buttons section (3 columns)
Toolstrip example (basic controls)
section1 = hTab.addSection('Push buttons');

column1a = section1.addColumn();
icon = Icon.REFRESH_24; % built-in: see Icon.showStandardIcons()
button = Button('Refresh all',icon);
button.Description = 'Refresh the charted data - all axes';
button.ButtonPushedFcn = @refreshAllData;
column1a.add(button);
function refreshAllData(hAction,hEventData)
    hAxes = gca;
    hChildren = hAxes.Children;
    for idx = 1 : numel(hChildren)
        hChild = hChildren(idx);
        hChild.XData = -hChild.XData;
        hChild.YData = -hChild.YData;
        hChild.ZData = -hChild.ZData;
    end
end

column1b = section1.addColumn();
addRefresh2Button('X','Y');
addRefresh2Button('Y','Z');
function addRefresh2Button(type1, type2)
    import matlab.ui.internal.toolstrip.*
    hButton = Button(['Refresh ' type1 ',' type2], Icon.RESTORE_16);
    hButton.Description = ['Refresh the charted data - ' type1 ',' type2 ' axes'];
    hButton.ButtonPushedFcn = {@refres2AxisData, type1, type2};
    column1b.add(hButton);

    function refres2AxisData(~,~,type1,type2)
        hAxes = gca;
        hChildren = hAxes.Children;
        for idx = 1 : numel(hChildren)
            hChild = hChildren(idx);
            hChild.([type1 'Data']) = -hChild.([type1 'Data']);
            hChild.([type2 'Data']) = -hChild.([type2 'Data']);
        end
    end
end

column1c = section1.addColumn();
addRefresh1Button('X');
addRefresh1Button('Y');
addRefresh1Button('Z');
function addRefresh1Button(type)
    import matlab.ui.internal.toolstrip.*
    hButton = Button(['Refresh ' type], Icon.REDO_16);
    hButton.Description = ['Refresh the charted data - ' type ' axes'];
    addlistener(hButton, 'ButtonPushed', @refres1AxisData);  % {} not supported!
    column1c.add(hButton);

    function refres1AxisData(h,e)
        hAxes = gca;
        hChildren = hAxes.Children;
        for idx = 1 : numel(hChildren)
            hChild = hChildren(idx);
            hChild.([type 'Data']) = -hChild.([type 'Data']);
        end
    end
end
Toggle buttons section (2 columns)
section2 = hTab.addSection('Toggle buttons');
section2.CollapsePriority = 2;

column1 = Column();
section2.add(column1);
%icon = Icon.LEGEND_24;
icon = Icon(fullfile(matlabroot,'toolbox','shared','controllib','general','resources','toolstrip_icons','Legend_24.png')); % PNG/JPG image file (not GIF!)
button = ToggleButton('Legend',icon);
button.Description = 'Toggle legend display';
addlistener(button, 'ValueChanged', @(h,e)legend('toggle'));
column1.add(button);

column2 = section2.addColumn();
imagefile = fullfile(matlabroot,'toolbox','matlab','icons','tool_colorbar.png');
jIcon = javax.swing.ImageIcon(imagefile); % Java ImageIcon from file (inc. GIF)
%jIcon = javax.swing.ImageIcon(jIcon.getImage.getScaledInstance(24,24,jIcon.getImage.SCALE_SMOOTH))  % Resize icon to 24x24
icon = Icon(jIcon);
button = ToggleButton('Colorbar',icon);
button.Description = 'Toggle colorbar display';
button.ValueChangedFcn = @toggleColorbar;
column2.addEmptyControl();
column2.add(button);
column2.addEmptyControl();
function toggleColorbar(hAction,hEventData)
    if hAction.Selected
        colorbar;
    else
        colorbar('off');
    end
end
Checkboxes section (1 column 150px-wide), placed after the push-buttons section
section3 = Section('Checkboxes');
section3.CollapsePriority = 1;
hTab.add(section3, 2);

column3 = section3.addColumn('HorizontalAlignment','left', 'Width',150);

button = CheckBox('Axes borders', true);
button.ValueChangedFcn = @toggleAxes;
button.Description = 'Axes borders';
column3.add(button);
function toggleAxes(hAction,hEventData)
    if hAction.Selected
        set(gca,'Visible','on');
    else
        set(gca,'Visible','off');
    end
end

button = CheckBox('Log scaling', false);
button.addlistener('ValueChanged',@toggleLogY);
button.Description = 'Log scaling';
column3.add(button);
function toggleLogY(hCheckbox,hEventData)
    if hCheckbox.Value, type = 'log'; else, type = 'linear'; end
    set(gca, 'XScale',type, 'YScale',type, 'ZScale',type);
end

button = CheckBox('Inverted Y', false);
button.addlistener('ValueChanged',@toggleInvY);
button.Description = 'Invert Y axis';
column3.add(button);
function toggleInvY(hCheckbox,~)
    if hCheckbox.Value, type = 'reverse'; else, type = 'normal'; end
    set(gca, 'YDir',type);
end
Summary
Creating a custom app toolstrip requires careful planning of the tabs, sections, controls and their layout, as well as preparation of the icons, labels and callbacks. Once you start playing with the toolstrip API, you’ll see that it’s quite easy to understand and to use. I think MathWorks did a good job in general with this API, and it’s a pity that they did not make it public or official long ago (the MCOS API discussed above existed since 2014-2015; earlier versions existed at least as far back as 2011). Comparing the changes made in the API between R2018a and R2018b shows quite minor differences, which may possibly means that the API is now considered stable, and therefore that it might well be made public in some near-term future. Still, note that this API may well change in future releases (for example, naming of the control properties that I mentioned above). It works well in R2018b, as well as in the past several Matlab releases, but this could well change in the future, so beware.
In the following posts I will discuss advanced control customizations (icons, callbacks, collapsibility etc.), complex controls (drop-downs, pop-ups, lists, button groups, items gallery etc.) and low-level toolstrip creation and customization. As I said above, Matlab toolstrips are quite an extensive subject and so I plan to proceed slowly, with each post building on its predecessors. Stay tuned!
In the meantime, if you would like me to assist you in building a custom toolstrip or GUI for your Matlab program, please let me know.

 One thing with the modified code is that it is necessary to add an attachment to send an...
Is it possible to change the background color of the toolstrip?
The gradient metal color has lower contrast (black on dark gray) than the traditional menu bar,
It is more difficult for me to read the text.
hi Yair,
first of all, thanks a lot for all the detailed and useful info you wrote about toolstrips. Are you planning to explain how to add and customize toolstrips for figures created with GUIDE?
best
Ramiro
I plan to discuss this in a future post
great. By the way, I tried the code you posted in section 2 of the toolstrips and noticed an error while trying to create a section (“% “Section” cannot be added to “Tab” after toolstrip is rendered.”). This happens all the time when i tried to add a section regardless of the 2 methods you described above. What’s causing this behavior? best
As the error says, you can’t update a toolstrip after it has been rendered (shown). Simply move the
hToolGroup.open()command to the end of your script/function.hi Yair, I tried that before but i’ve got a weird toolgroup that changed the name and showed no toolstrip at all and was docked to the command window too. I can send you the picture of it if you want. If i open the toolgroup at the start everything looks fine but i can’t add a section.
best
Ramiro – I’m sorry, but I only do private consulting projects as (well) private consulting projects…
Try to display the tool-group at other places within your code, before the end.
hi Yair,
i was just trying to reproduce the code you freely publish on your site to test the features of the toolstrip. I guess other readers of your blog will encounter the same issue and I thought you should be aware of it. I’ve already tried opening the toolgroup at other instances with the same effect.
I added a downloadable file that can be run as-is, at the top of the Usage Examples section.
hi Yair, thanks for the file you uploaded to the usage examples section.
Happy New Year! best
hi Yair,
thx so much for this post.
i have a question: is it possible to manully set an openiong Position or Size for this toolgroup?
i have tried all day and i can not find any Container, which has the ‘position’ properties or something alike.
best regards
@Chen – I will discuss positioning and layout in a future post, but for now you can adapt the following script. Note that the positioning uses Java-based coordinates, which is (0,0) at the top-left corner of the screen, and increases downward and to the right, and the position is for the tool-group’s top-left corner. So, position (100,200,800,600) means a 800×600 window whose top-left corner is 100 pixels to the right, and 200 pixels below, the screen’s top-left corner.
Hi Yair,
thx for your answer
i have tried with your suggestion:
but i got error:
PS: i’m using Matlab 2016b.
@Chen – 16b is a relatively old release (19a is 5 releases ahead). It is quite possible that the setPosition method was added in one of these later releases. I have not investigated this but it’s possible that there may have been an alternative method in 16b (e.g. setLocation or whatever). You can run
methodview(hTG)to check the possibilities, or upgrade to a later Matlab release.Thx a lot.
i think, it is probably impossible in 16b to set an opening size. i haven’t found any available function
but this is not that bad, in 16b the most new futures of toolgroup still work and till now they are enough for me.
Thx u again for ur post
Chen
I don’t believe the R2016b version has any methods to set position
You can do it through the desktop:
Collin
Thx so much, Collin.
This works 😀
Hi, I have a question, can I use something like “handles”, that we have in GUI?
@Arash – the “handles” that you refer to is a simple Matlab struct that contains the GUI handles in separate fields. You can easily create it in your code by assigning each created GUI object (tab, section, column, button etc.) a separate field in the struct, and in the end saving this struct somewhere. You cannot use guidata or guihandles because they only work with figures (not apps), but you can store the handles struct elsewhere e.g. in a global variable, or attached to one of the figures that you dock into your app.
Hi Yair,
Thank you for all your great posts. They’re all extremely helpful. Could you please help me with an issue I’m facing? I’ve built an application with a ToolGroup and when using the Matlab Application Compiler, in the compiled standalone version, I cannot get hToolGroup.addFigure to dock a new figure in the existing ToolGroup window. I have tried a number of approaches and have been unsuccessful. For this application I am currently using Matlab 2017b.
Thank you,
Endri
Unfortunately, docking figures into ToolGroups is for some unknown reason (apparently deliberately) prevented by the Matlab Compiler. I am not aware of any workaround for this, at the moment.