Customizing axes part 3 – Backdrop
Posted By Yair Altman On October 22, 2014 | 6 Comments
In the past two weeks I explained how HG2 (in R2014b) enables us to customize the axes rulers [1], baselines, box and grid-lines [2] in ways that were previously impossible in HG1 (R2014a or earlier). Today I will describe another useful undocumented property of the HG2 axes – Backdrop.
Backdrop
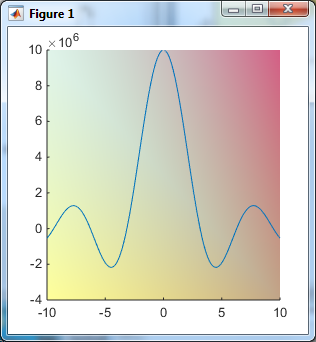
The axes’ Backdrop property (a matlab.graphics.axis.decorator.Backdrop object) controls the background color of the axes’ content area. This is normally white, but can be set to any color, including translucency:
% Create the plot
x = -10:0.1:10;
y = 1e7*sin(x)./x;
hLine = plot(x,y);
hAxes = gca;
box('off');
% Set a light-yellow backdrop
hAxes.Backdrop.FaceColor = [1, 1, 0, 0.4];
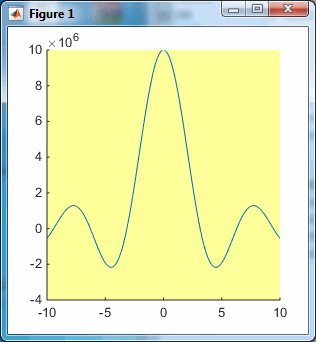
By default, Backdrop spans the entire (rectangular) axes content area. But we can customize its vertex points using the Face.VertexData property, which accepts an array of 3xN singles:
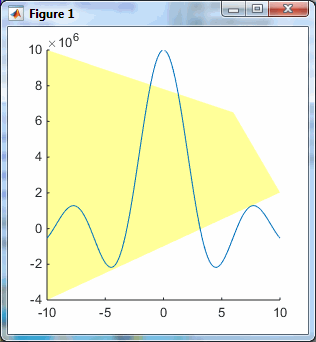
% Note: VertexData is specified in normalized (0-1) units, not data units
hAxes.Backdrop.Face.VertexData = single([0,1,0.8,0; 0,0.43,0.75,1; 0,0,0,0]);  % default: [0,1,1,0; 0,0,1,1; 0,0,0,0]
>> hAxes.Backdrop.Face.get
             AmbientStrength: 0.3
             BackFaceCulling: 'none'
                ColorBinding: 'object'
                   ColorData: [4x1 uint8]
                   ColorType: 'truecoloralpha'
             DiffuseStrength: 0.6
            HandleVisibility: 'off'
                     HitTest: 'off'
                       Layer: 'back'
               NormalBinding: 'none'
                  NormalData: []
                      Parent: [1x1 Backdrop]
               PickableParts: 'all'
    SpecularColorReflectance: 1
            SpecularExponent: 10
            SpecularStrength: 0.9
                   StripData: []
                     Texture: []
            TwoSidedLighting: 'off'
                  VertexData: [3x4 single]
               VertexIndices: []
                     Visible: 'on'
The down side is that whenever we modify anything in the axes (or even get some axes property values), Face.VertexData is reset back to its default value of [0,1,1,0; 0,0,1,1; 0,0,0,0], so we need to either update it in a timer and/or in a property listener.
We can create a tint (gradient color) effect by setting the Face.ColorData property to match the vertex points and modifying Face.ColorBinding from the default ‘object’ to ‘interpolated’ (other alternative values are ‘discrete’ and ‘none’):
colorData = uint8([255, 150, 200, 100; ...  % instead of [255;255;0;102] = light-yellow
                   255, 100,  50, 200; ...
                     0,  50, 100, 150; ...
                   102, 150, 200,  50]);
set(hAxes.Backdrop.Face, 'ColorBinding','interpolated', 'ColorData',colorData);
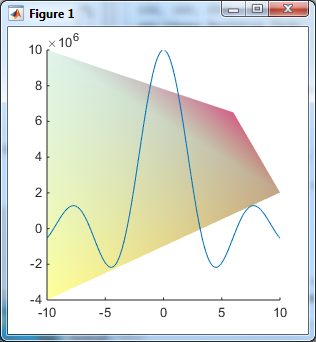
The tint effect does not rely on the vertex – we can set a tinted background for the entire content area by modifying Face.ColorData without modifying the vertexes:

Using a patch
Of course, one could say that using Backdrop is not much better than creating a patch that has the specified vertex points and colors. For example (note that Backdrop has different color and vertex units than a patch):
% Create a patch to replace the backdrop
cdata = [255, 150, 200, 100; ...
         255, 100,  50, 200; ...
           0,  50, 100, 150 ...
        ]' / 255;  % alpha values are not directly accepted by patch CData
vertexData = [0,1,0.8,0; 0,0.43,0.75,1];  % in normalized units
xdata = hAxes.XLim(1) + diff(hAxes.XLim)*vertexData(1,:);  % in data units
ydata = hAxes.YLim(1) + diff(hAxes.YLim)*vertexData(2,:);  % in data units
hPatch = patch(xdata, ydata, 'k', 'Parent',hAxes, 'EdgeColor','none', ...
               'FaceVertexCData',cdata, 'FaceColor','interp', ...
               'FaceVertexAlpha',[102;150;200;50]/255, 'FaceAlpha','interp');
This results in a gradient very similar to the Backdrop, although not exactly the same. Perhaps the color interpolation for Backdrop is different than for patches, or maybe I just made a mistake somewhere above…
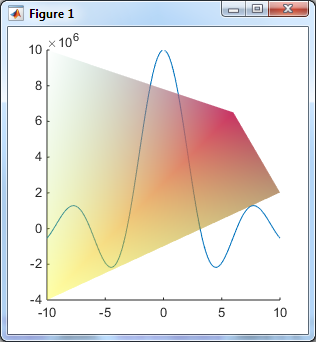
I don’t have a good answer as to why MathWorks chose to add the Backdrop property to HG2 axes and what advantage it might have over a separate patch. If anyone has an idea, please post a comment below. We can be pretty sure that this was discussed at MathWorks, since Michelle Hirsch, who heads Matlab product development at MathWorks, posted a utility [3] that implements a patch-based gradient backdrop back in 2010 and has recently rehosted it on GitHub:

Next week, I will conclude the mini-series on axes customizations by describing some additional undocumented axes features.
Categories: Handle graphics, Medium risk of breaking in future versions, Stock Matlab function, Undocumented feature
6 Comments (Open | Close)
Article printed from Undocumented Matlab: https://undocumentedmatlab.com
URL to article: https://undocumentedmatlab.com/articles/customizing-axes-part-3-backdrop
URLs in this post:
[1] axes rulers: http://undocumentedmatlab.com/blog/customizing-axes-rulers
[2] baselines, box and grid-lines: http://undocumentedmatlab.com/blog/customizing-axes-part-2
[3] utility: http://www.mathworks.com/matlabcentral/fileexchange/29797-add-a-background-gradient-to-plots
[4] Customizing axes part 4 – additional properties : https://undocumentedmatlab.com/articles/customizing-axes-part-4-additional-properties
[5] Customizing axes rulers : https://undocumentedmatlab.com/articles/customizing-axes-rulers
[6] Customizing axes part 2 : https://undocumentedmatlab.com/articles/customizing-axes-part-2
[7] Customizing axes part 5 – origin crossover and labels : https://undocumentedmatlab.com/articles/customizing-axes-part-5-origin-crossover-and-labels
[8] Customizing axes tick labels : https://undocumentedmatlab.com/articles/customizing-axes-tick-labels
[9] Customizing histogram plots : https://undocumentedmatlab.com/articles/customizing-histogram-plots
[10] : https://undocumentedmatlab.com/blog/hg2-update
[11] : https://www.mathworks.com/matlabcentral/newsreader/view_thread/337755#937008
Click here to print.
6 Comments To "Customizing axes part 3 – Backdrop"
#1 Comment By Michelle Hirsch On October 24, 2014 @ 10:09
Thanks for the shout out, Yair! I wish I could say that there were lots of discussions about my file exchange submission, but I’m pretty sure nobody else at MathWorks even knows about it :). I’m also quite sure that I wasn’t thinking about this property that you are writing about when I built it – I think I just felt like making something look a little fancy.
#2 Comment By Yair Altman On October 25, 2014 @ 13:27
@Michelle – Thanks for the correction. I guess this proves one of the important fallacies in any intelligence work, of connecting dots between seemingly-connected events that are in fact unrelated. It’s a constant risk that I take with my speculation work on this blog, and hopefully I’m not too far off most of the time. It’s much safer not to speculate at all, but there’s no fun in that 🙂
In any case, perhaps your earlier work on your FEX utility back in 2010 led you (even if only on a subconscious level) to the need to add this functionality as an HG2 axes property. After all, you posted the utility as an answer to some user need, and I can definitely see this need arising in various forms over the years. Since in the back of your mind you already had the idea of a gradient backdrop, I can imagine that at some meeting where this came up you’d say something along the lines of “why not add a Backdrop property in the brand-new HG2 axes that we’re now designing?“. Pure speculation again, of course. But if I’m right, then perhaps I wasn’t too far off in connecting the dots here after all.
I know that I have often encountered problems in my work that I solved in a certain way, only to discover that I handled the same problem in the past in a very similar manner. So maybe I was influenced by some distant subconscious memory of my earlier solution, or maybe my mind is simply wired in such a way that I rediscover the same solution to the same problem.
#3 Pingback By Customizing axes part 4 – additional properties | Undocumented Matlab On October 29, 2014 @ 11:01
[…] Customizing axes part 4 – additional properties […]
#4 Comment By Thurston Herricks On September 23, 2015 @ 12:48
Hello Dr. Altman,
I am trying generate a GUI that has a a few patches in it. Even with relatively few patches with 600 faces I experience significant performance issues with the GUI when it redraws. Could the difference in adding a backdrop verse using a patch be a performance issue?
#5 Comment By Yair Altman On September 23, 2015 @ 13:02
@Thurston – I assume this is due to the slowdown in Matlab’s new graphics system ( [10]) in R2014b, for some graphic aspects. In your case, using patches probably implies use of the OpenGL renderer, which is a known performance hotspot. MathWorks [11] on improving HG2’s performance, but it’s not simple and so far (R2015b) they have not been successful in restoring Matlab graphics performance to HG1’s levels. I suggest that you report this issue to MathWorks so that they could look into it and possibly fix it in a future release.
#6 Comment By Karel Lebeda On August 25, 2016 @ 18:27
In my opinion, the difference between creating the gradient using patch is the following:
– Patch uses the actual (Euclidean) distances for the interpolation. That’s why there is the red “spike” going from the red vertex down and left, and why the diagonal intersection is red (closest to the red vertex).
– On the other hand, backdrop seems to be using something like barycentric coordinates, or like if it computed the gradient in the square coordinate space and then used homography to “warp” the image. That’s why there’s such a huge yellow area around the “far away” bottom vertex, which in barycentric coordinates would appear as close as any other, hence its neighbourhood is stretched. And the diagonal intersection naturally has the mean grey colour…
I didn’t do a proper test, where I would do the interpolation “manually”, but I believe this is what is happening there…