In the past three weeks I explained how HG2 (in R2014b) enables us to customize the axes rulers, back-drop, baselines, box and grid-lines in ways that were previously impossible in HG1 (R2014a or earlier). Today I will conclude the mini-series on axes customizations by describing other useful undocumented customizations of the HG2 axes:
Camera
The Camera object (matlab.graphics.axis.camera.Camera3D) controls the 3D camera/lighting of the axes. Camera is a new hidden property of HG2 axes, that did not exist in earlier Matlab releases (HG1). This functionality is normally controlled via the 3D figure toolbar and related functions (view, camup, campos etc.). We can have better granularity by discretely customizing Camera‘s properties:
>> hAxes.Camera.get AspectRatio: 1 Children: [] DepthCalculationHint: 'careful' DepthSort: 'on' HandleVisibility: 'off' Parent: [1x1 Axes] PlotBoxAspectRatio: [1 1 1] PlotBoxAspectRatioMode: 'auto' Position: [-4.06571071756541 -5.45015005218426 4.83012701892219] Projection: 'orthographic' Target: [0.5 0.5 0.5] TransparencyMethodHint: 'depthpeel' UpVector: [0 0 1] ViewAngle: 10.339584907202 Viewport: [1x1 matlab.graphics.general.UnitPosition] Visible: 'on' WarpToFill: 'vertical' |
SortMethod
SortMethod is a newly-supported axes property in R2014b. It is new only in the sense that it became documented: It has existed in its present form also in previous Matlab releases, as a hidden axes property (I’m not sure exactly from which release). This is yet another example of an undocumented Matlab functionality that existed for many years before MathWorks decided to make it official (other examples in R2014b are the set of uitab/uitabgroup functions).
SortMethod is important due to its impact on graphic rendering performance: By default, Matlab draws objects in a back-to-front order based on the current view. This means that objects (lines, patches etc.) which should appear “on top” of other objects are drawn last, overlapping the objects “beneath” them. Calculating the order of the objects, especially in complex plots having multiple overlapping segments, can take noticeable time. We can improve performance by telling the renderer to draw objects in the order of the Children property, which is typically the order in which the objects were created. This can be done by setting the axes’ SortMethod property to ‘childorder’ (default=’depth’). Since SortOrder existed in past Matlab releases as well, we can use this technique on the older MATLAB releases just as for R2014b or newer.
In a related matter, we should note that transparent/translucent patches and lines (having a 4th Color element (alpha) value between 0.0 and 1.0) are slower to render for much the same reasons. Reducing the number of transparent/translucent objects will improve graphics rendering performance. Note that specifying a 4th Color element is again an undocumented feature: Matlab officially only supports RGB triplets and named color strings, not RGBA quadruplets. I’ll discuss this aspect next week.
WarpToFill
WarpToFill (default=’on’) is a simple flag that controls whether or not the axes should fill its container (panel or figure), leaving minimal margins. We can consider this as another variant to the documented alternatives of the axis function:
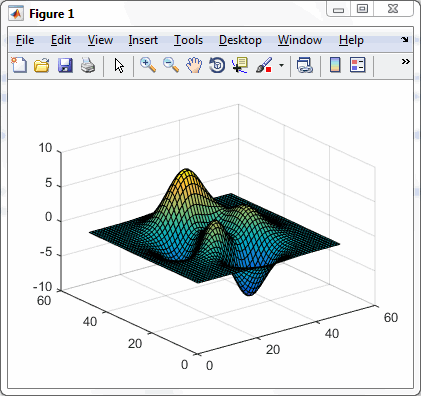
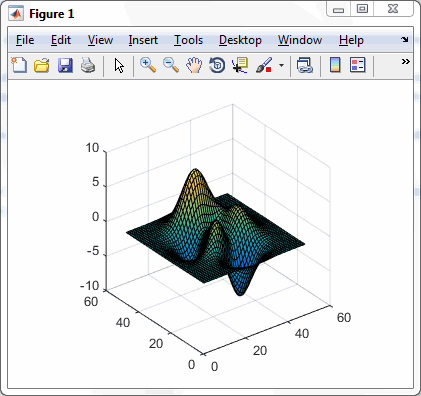
surf(peaks); set(gca,'WarpToFill','off'); |


Note that WarpToFill is not new in R2014b – it has existed in its present form also in previous Matlab releases, as a hidden axes property. One would hope that it will finally become officially supported, as SortMethod above has.
Additional properties
Additional undocumented aspects of Matlab axes that I have reported over the years, including the LooseInset property and determining axes zoom state, still work in HG2 (R2014b). They might be removed someday, but hopefully they will take the opposite path that SortMethod did, of becoming fully supported.
On the other hand, some important undocumented HG1 axes properties have been removed: x_NormRenderTransform, x_ProjectionTransform, x_RenderOffset, x_RenderScale, x_RenderTransform, x_ViewPortTransform and x_ViewTransform could be used in HG1 axes to map between 3D and 2D data spaces. Some users have already complained about this. I have [still] not found a simple workaround for this, but I’m pretty sure that there is one. Maybe the hidden axes DataSpace property could be used for this, but I’m not sure how exactly. Edit: see my post on view transformations (and the reader comments on it).
This concludes my series on undocumented HG2 axes customizations (at least for now). Next week, I will describe undocumented HG2 plot-line customizations.


Hi Yair-
Great information. I’ve been using some code that accessed x_RenderTransform, x_RenderOffset, and x_RenderScale undocumented properties in HG1, that “broke” in HG2. I’ve been in search of a solution, and your tips in your blog are the closest I’ve come. I’m ever hopeful that a workaround will arise, but I’m not experienced enough to take it myself.
Thanks for the blog,
Jill
Has anyone found an alternative to the x_RenderOffset, x_RenderScale, x_RenderTransform axes properties? I have been working for a long time and have not found a workaround.
Sher
@Sher – have you seen my recent post on view transformations (and the reader comments on it)?
Hello Yair,
I used the select3d tool from matlab file exchange to find, where the mouse clicked on 3d, surface. Since matlab 2014, the select3d function seems to don’t work anymore because, “x_RenderTransform” and other propertiese were removed.
However, now the matlab provides the coordinates of the section of mouse point and the surface as the second parameter of the surface callback.
K>> varargin{2}
ans =
Hit with properties:
Button: 1
IntersectionPoint: [20.8219 16.8589 20.7370]
Source: [1×1 Surface]
EventName: ‘Hit’
Hey everybody!
I got a little update on this one, fixing the select3d for Matlab >= R14b.
Replacing
with
should work perfectly all right (tested with linear axes and DataAspectRatio=1).
One might change the condition
to something more elegant. This code line assumes the axes object ax is direct child to the figure (which fits in my case). An alternative might be checking the matlab version with
, since the graphics update came in 8.4 (R14b).
Note, that the transposition of vert and cp in the arguments of specgraphhelper(…) is crucial to the result. Transposing one of them leads to wrong results.
Hope it helps,
Ray