Anyone who has had experience with real-life applications knows that Memory usage can have a significant impact on the application’s usability, in aspects such as performance, interactivity, and even (on some lousy memory-management Operating Systems) crashes/hangs.
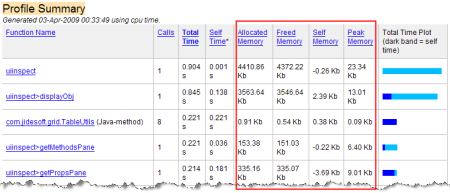
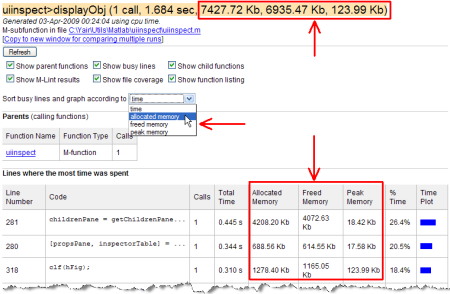
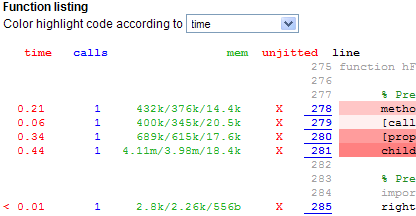
In Matlab releases of the past few years, this has been addressed by expanding the information reported by the built-in memory function. In addition, an undocumented feature was added to the Matlab Profiler that enables monitoring [1] memory usage.


In Matlab release R2008a (but not on newer releases) we could also use a nifty parameter of the undocumented feature function [2]:
>> feature mtic; a=ones(100); feature mtoc
ans =
      TotalAllocated: 84216
          TotalFreed: 2584
    LargestAllocated: 80000
           NumAllocs: 56
            NumFrees: 43
                Peak: 81640
As can easily be seen in this example, allocating 1002 doubles requires 80000 bytes of allocation, plus some 4KB others that were allocated (and 2KB freed) within the function ones. Running the same code line again gives a very similar result, but now there are 80000 more bytes freed when the matrix a is overwritten:
>> feature mtic; a=ones(100); feature mtoc
ans =
      TotalAllocated: 84120
          TotalFreed: 82760
    LargestAllocated: 80000
           NumAllocs: 54
            NumFrees: 49
                Peak: 81328
This is pretty informative and very handy for debugging memory bottlenecks. Unfortunately, starting in R2008b, features mtic and mtoc are no longer supported “under the current memory manager [3]“. Sometime around 2010 the mtic and mtoc features were completely removed. Users of R2008b and newer releases therefore need to use the internal structs returned by the memory function, and/or use the profiler’s memory-monitoring feature. If you ask me, using mtic/mtoc was much simpler and easier. I for one miss these features.
In a related matter, if we wish to monitor Java’s memory used within Matlab, we are in a bind, because there are no built-in tools to help us. there are several JVM switches that can be turned on in the java.opts [4] file: -Xrunhprof[:help]|[:option=value,…], -Xprof, -Xrunprof, -XX:+PrintClassHistogram and so on [5]. There are several memory-monitoring (so-called “heap-walking”) tools: the standard JDK jconsole, jmap, jhat and jvisualvm (with its useful plugins) provide good basic coverage. MathWorks has posted [6] a tutorial on using jconsole with Matlab. There are a number of other third-party tools such as JMP [7] (for JVMs 1.5 and earlier) or TIJMP [8] (for JVM 1.6). Within Matlab, we can use utilities such as Classmexer [9] to estimate a particular object’s size (both shallow and deep referencing), or use java.lang.Runtime.getRuntime()‘s methods (maxMemory(), freeMemory() and totalMemory()) to monitor overall Java memory (sample usage [10]).
We can monitor the Java memory (which is part of the overall Matlab process memory) usage using Java’s built-in Runtime [11] class:
>> r=java.lang.Runtime.getRuntime
r =
java.lang.Runtime@5fb3b54
>> r.freeMemory
ans =
    86147768
>> r.totalMemory
ans =
   268304384
>> usedMemory = r.totalMemory - r.freeMemory;
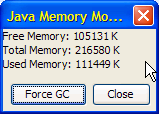
Specifically in R2011b (but in no other release), we can also use a built-in Java memory monitor. Unfortunately, this simple and yet useful memory monitor was removed in R2012a (or maybe it was just moved to another package and I haven’t found out where… yet…):
com.mathworks.xwidgets.JavaMemoryMonitor.invoke

As I have already noted quite often, using undocumented Matlab features and functions carries the risk that they will not be supported in some future Matlab release. Today’s article is a case in point.
8 Comments To "Profiling Matlab memory usage"
#1 Comment By julien On March 1, 2012 @ 14:09
Yair,
Have you ever used jtimp to profile java memory inside matlab?
I added “-agentlib:tijmp” in the java.opts file, added the tijmp.dll directory path in librarypath.txt file but matlab does not start any more (OS is windows XP)
Thanks !
#2 Comment By Yair Altman On March 1, 2012 @ 15:07
@Julien – I’m afraid I don’t have a specific experience with tijmp. Your problem may be due to a missing jdwp.dll library file, which is required by the Java debugger but missing from Matlab’s JRE distribution. See MathWorks technical solution [18]. Possibly some other DLL is missing. Other reported problems with the agentlib that cause Matlab to fail to start were reported [19]. I briefly discuss this in section 1.6 of my book, by the way.
If you do learn anything new, please post a followup comment here, for the benefit of others.
#3 Pingback By Internal Matlab memory optimizations | Undocumented Matlab On May 30, 2012 @ 07:23
[…] If we profile our code using any of Matlab’s memory-profiling options, we will see that the copy operation data2=data1 takes negligible time to run and allocates no memory […]
#4 Pingback By File deletion memory leaks, performance | Undocumented Matlab On September 5, 2012 @ 11:02
[…] To monitor Matlab’s Java heap space size in runtime, see my article from several months ago, or use Elmar Tarajan’s memory-monitor utility from the File Exchange. […]
#5 Pingback By Undocumented Profiler options part 2 | Undocumented Matlab On September 24, 2012 @ 03:11
[…] Since then, I have posted several articles about performance tuning and profiling (for example, memory profiling) but nothing specifically about the Profiler. […]
#6 Comment By Ian Schillebeeckx On November 29, 2012 @ 16:09
What about:
?
#7 Comment By Yair Altman On November 29, 2012 @ 16:44
@Ian – this was mentioned at the very top of this article:
#8 Pingback By Assessing Java object size in Matlab | Undocumented Matlab On January 29, 2014 @ 11:39
[…] a couple of years ago I posted an article on profiling Matlab’s memory usage, which included a section on Java memory […]