Back in 2012, I wrote an article about the Matlab profiler’s undocumented functionality of storing detailed information about the function-call history, including timing information. I intended to follow up on this with a utility that would bring the data to life, but I never found the time for this. With my upcoming book on Matlab performance now nearing publication (ETA: November 2014), I decided it’s finally time to finish the task. The result is my profile_history utility, available for download on the Matlab File Exchange (open-source):
Usage of profile_history is very easy, based on the latest profiling session:
profile on; surf(peaks); profile_history |

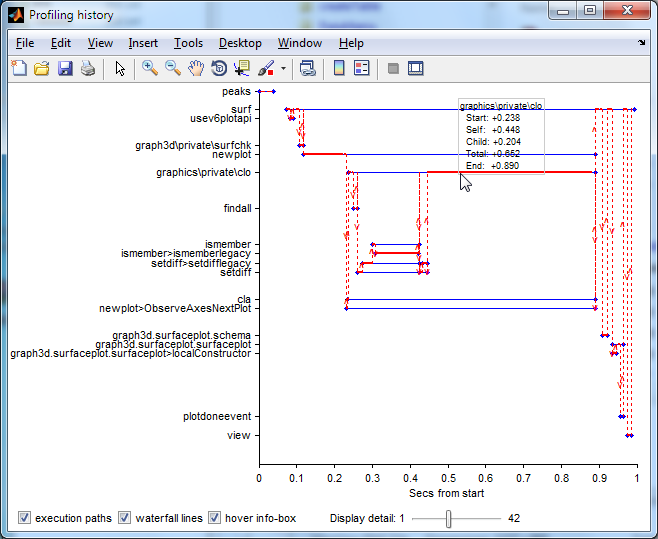
Function call timeline profiling (click for full-size image)
The function-call is displayed in a waterfall graph, where thick red lines mark the self (CPU-execution) time, and blue lines mark the calling (parent) functions. Dotted red lines connect the parent (calling) and child (called) functions, such that it is easy to see which function was called, when, and by whom. The graph is interactive: panning and zooming are possible, and clicking on any of the function labels or graph lines opens up the detailed (standard, builtin) profiler report for that function. In addition, an info-box is displayed whenever we move the mouse over the contents. This info-box displays information about the pointed-to call invocation, including its function name, start-time, self-time, time spent in children, total duration and the end time. If the function was called multiple times during the profiling session, then additional information about these other invocations is also displayed. The info-box, dotted waterfall lines, and the red execution lines can be turned on/off, using checkboxes at the bottom of the figure window.
We can also run profile_history on pre-stored profiling data:
profile on; myProgram(); profData=profile('info'); profile_history(profData) |
Why is this important?
So yes, this is a cool utility, but does it really add information that was not already available if we dug down in the standard profiler report?
The answer is a definite YES. Let’s take the following simple example:
function perfTest for idx = 1 : 10 pause(0.02); nestedFunction(); subFunction(idx); end function nestedFunction pause(0.03); end end function subFunction(idx) if idx > 1 pause(0.05); else pause(0.5); end end |
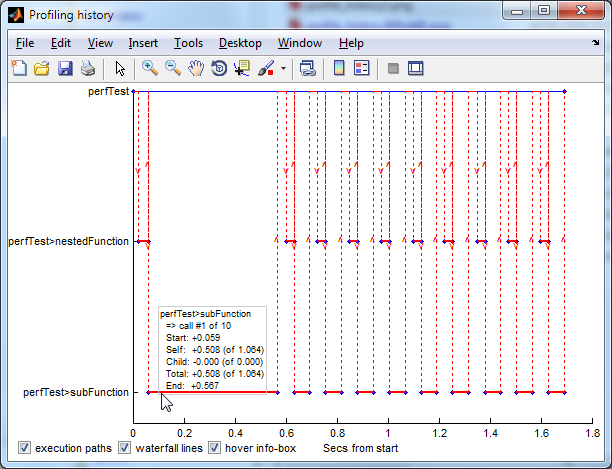
The standard profiler report simply tells us that perfTest ran once, taking 1.69 secs, calling perfTest>subFunction 10 times running a total of 1.06 secs. There is no information, even in the detailed report, about which of the 10 invocations of subFunction was responsible for the majority of the run-time, or whether all 10 invocations took approximately ~0.1 secs each. Looking at the code above we can see that the first invocation was indeed significantly slower, but in general we do not know that a certain invocation is in fact much slower than the rest.
Enter profile_history: a single look at the output, possibly with a few mouse hovers over the relevant red invocation segments, immediately shows us that the first invocation of subFunction was responsible for the majority of the run-time. If we just improve this single invocation, rather than improve the general case, we achieve the maximal benefit from our performance-tuning effort.

For a detailed discussion of the profiling timing data that underlies profile_history, please refer to my aforementioned article.
Some ideas for potential future development:
- event markers (figure open/close, uicontrol actions, I/O, …)
- function labels color based on type (GUI/algo/internal/…)
- top-down vs. bottom-up presentation
- aggregated by function or not (i.e., full waterfall; duplicate function names on different rows)
- automatically highlight performance hotspots
- integrate in existing Profiler report (profview)
- additional info-box data
Let me know what you think of all this in a comment below!


Dear Yair,
When I run the code
I get the following error message:
However, when I removed @ from the @char folder’s name, it works like a charm.
@Ali – thanks, I just updated the FEX utility with a fix to this edge-case.
Sounds great! I have not had a chance to try it yet. I look forward to the publication of your book;
MATLAB Performance Tuning: Making your MATLAB Program Fly
@Wes – the title might change a bit by the time it actually gets published in a few months, but the ISBN and web link will remain unchanged.
It might be useful to be able to put a option to limit the number of function levels in view (i.e. How many sub-functions you delve down into for displaying their commands) … such that your not displaying so many commands. That could help visualize the general problem areas and let you dive down into those without getting so many display objects on the figure (which ultimately stops he usefulness).
@Dan – I uploaded an update to the profile_history utility with the ability to programmatically and interactively control the number of displayed functions (default = 15), sorted by descending total time.
Hi
I wont to apply a row filter like Excel to uitable to select multiple items contained in the column.
do you have any suggestion or example shopping how to do?
Thanks in advance
Andrea
@Andrea – this is covered in my uitable customization report
[…] This wrapper function can then be placed within a @char folder somewhere in the Matlab path. I used a similar trick for my profile_history utility last month. […]