Undocumented plot marker types
Posted By Yair Altman On March 13, 2019 | 1 Comment
I wanted to take a break from my miniseries on the Matlab toolstrip to describe a nice little undocumented aspect of plot line markers. Plot line marker types have remained essentially unchanged in user-facing functionality for the past two+ decades, allowing the well-known marker types (.,+,o,^ etc.). Internally, lots of things changed in the graphics engine, particularly in the transition to HG2 [1] in R2014b and the implementation of markers using OpenGL primitives [2]. I suspect that during the massive amount of development work that was done at that time, important functionality improvements that were implemented in the engine were forgotten and did not percolate all the way up to the user-facing functions. I highlighted a few of these in the past, for example transparency and color gradient for plot lines [3] and markers [4], or various aspects of contour plots [5].
Fortunately, Matlab usually exposes the internal objects that we can customize and which enable these extra features, in hidden properties of the top-level graphics handle. For example, the standard Matlab plot-line handle has a hidden property called MarkerHandle that we can access. This returns an internal object that enables marker transparency and color gradients [4]. We can also use this object to set the marker style to a couple of formats that are not available in the top-level object:
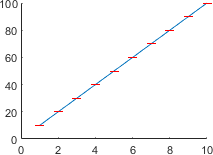
>> x=1:10; y=10*x; hLine=plot(x,y,'o-'); box off; drawnow;
>> hLine.MarkerEdgeColor = 'r';
>> set(hLine, 'Marker')'  % top-level marker styles
ans =
  1×14 cell array
    {'+'} {'o'} {'*'} {'.'} {'x'} {'square'} {'diamond'} {'v'} {'^'} {'>'} {'<'} {'pentagram'} {'hexagram'} {'none'}
>> set(hLine.MarkerHandle, 'Style')'  % low-level marker styles
ans =
  1×16 cell array
    {'plus'} {'circle'} {'asterisk'} {'point'} {'x'} {'square'} {'diamond'} {'downtriangle'} {'triangle'} {'righttriangle'} {'lefttriangle'} {'pentagram'} {'hexagram'} {'vbar'} {'hbar'} {'none'}
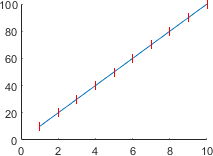
We see that the top-level marker styles directly correspond to the low-level styles, except for the low-level ‘vbar’ and ‘hbar’ styles. Perhaps the developers forgot to add these two styles to the top-level object in the enormous upheaval of HG2. Luckily, we can set the hbar/vbar styles directly, using the line’s MarkerHandle property:
hLine.MarkerHandle.Style = 'hbar';
set(hLine.MarkerHandle, 'Style','hbar');  % alternative


USA visit
I will be travelling in the US in May/June 2019. Please let me know (altmany at gmail) if you would like to schedule a meeting or onsite visit for consulting/training, or perhaps just to explore the possibility of my professional assistance to your Matlab programming needs.
Categories: Handle graphics, Hidden property, Low risk of breaking in future versions, Stock Matlab function, Undocumented feature
1 Comment (Open | Close)
Article printed from Undocumented Matlab: https://undocumentedmatlab.com
URL to article: https://undocumentedmatlab.com/articles/undocumented-plot-marker-types
URLs in this post:
[1] transition to HG2: https://undocumentedmatlab.com/blog/hg2-update
[2] implementation of markers using OpenGL primitives: https://blogs.mathworks.com/graphics/2015/11/10/memory-consumption/#comment-465
[3] plot lines: https://undocumentedmatlab.com/blog/plot-line-transparency-and-color-gradient
[4] markers: https://undocumentedmatlab.com/blog/plot-markers-transparency-and-color-gradient
[5] various aspects of contour plots: https://undocumentedmatlab.com/blog/hidden-hg2-plot-functionality
[6] Types of undocumented Matlab aspects : https://undocumentedmatlab.com/articles/types-of-undocumented-matlab-aspects
[7] Undocumented scatter plot behavior : https://undocumentedmatlab.com/articles/undocumented-scatter-plot-behavior
[8] Plot markers transparency and color gradient : https://undocumentedmatlab.com/articles/plot-markers-transparency-and-color-gradient
[9] Undocumented scatter plot jitter : https://undocumentedmatlab.com/articles/undocumented-scatter-plot-jitter
[10] Accessing hidden HG2 plot functionality : https://undocumentedmatlab.com/articles/hidden-hg2-plot-functionality
[11] Plot line transparency and color gradient : https://undocumentedmatlab.com/articles/plot-line-transparency-and-color-gradient
Click here to print.
1 Comment To "Undocumented plot marker types"
#1 Comment By Yaroslav On March 14, 2019 @ 14:44
Maybe they couldn’t find a good shortcut. The natural one for
hbarwould bebut it already has an interpretation (of a full line). Nonetheless, the shortcut might have been defined as
I also don’t see any problem with the natural shortcut for
vbar,In any case, it is a very useful feature that I will surely use in the future. Thanks, @Yair!