Yesterday I started presenting a multi-day Matlab training course for some client. As I was preparing the data visualization segment, I planned to show a programmatic implementation of scatterplot jitter when I came across an undocumented built-in implementation of exactly this mechanism, that I will describe today.
The problem with standard scatter plots
In a scatter plot, we cannot easily minor value differences, when the data points overlap each other. For example:
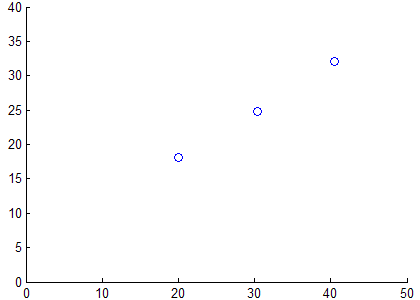
% Prepare the data groupX = ones(1,100) * 30; groupY = ones(1,100) * 24; singletonsX = [20,40]; singletonsY = [18,32]; dataX = [groupX,singletonsX]; dataY = [groupY,singletonsY]; % Display in a scatterplot scatter(dataX, dataY); xlim([0,50]); ylim([0,40]); |

Both data points look exactly the same and no amount of zooming-in will discover that there are 100 data points in the center data point compared to only a single data point in the top-right and lower-left. When we wish to visually convey density distributions of real values this could lead to erroneous assumptions about the data.
The solution: jitter the data
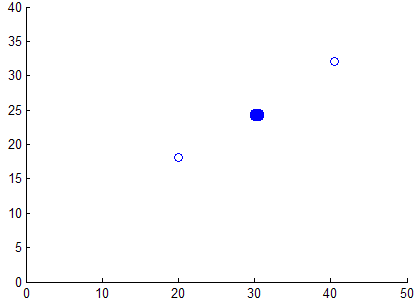
The solution that is generally used in such cases is to either use some other plot type to convey the density information (e.g., histograms, CDF or quantile plots), or to keep using scatter plots but jitter the data just a tiny bit that would enable users to visualize the density more clearly. Jittering the data introduces minor inaccuracies to the data, which some may find anathema, but it does solve the visualization problem:
jitterAmount = 0.5; jitterValuesX = 2*(rand(size(dataX))-0.5)*jitterAmount; % +/-jitterAmount max jitterValuesY = 2*(rand(size(dataY))-0.5)*jitterAmount; % +/-jitterAmount max scatter(dataX+jitterValuesX, dataY+jitterValuesY); |

Much better, don’t you think?
Matlab’s built-in jitter
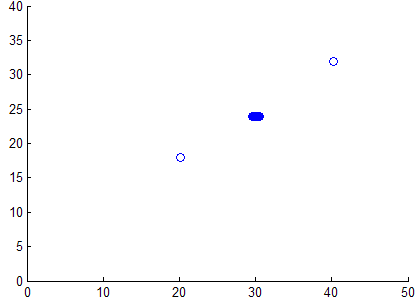
Interestingly, Matlab’s scatterplot has this mechanism built-in, using the undocumented hidden properties Jitter (default=’off’) and JitterAmount (default=0.2). Note that JitterAmount is an absolute (not relative) value, just as in my example above. Also, the built-in jitter only applies to the X data and does not jitter the Y values. Jitter is also applied only to 2D (not 3D) scatter plots:
scatter(dataX, dataY, 'jitter','on', 'jitterAmount',0.5); |

This built-in Jitter functionality has existed all the way back to Matlab 7.1 (2005), and possibly earlier. I know it did not exist in Matlab 6.0; I am unsure regarding releases 6.5 and 7.0. In any case, as far as undocumented functionality goes, this one is pretty ancient.
Customizing Matlab’s jitter
The jitter implementation is provided in %matlabroot%/toolbox/matlab/specgraph/@specgraph/@scattergroup/refresh.m lines 16-18 (in R2012a):
if ~is3D && strcmp(this.Jitter,'on') x = x + (rand(size(x))-0.5)*(2*this.JitterAmount); end |
As you can see, it is trivially easy to modify this code to include Y-data jitter, or to make JitterAmount a relative rather than an absolute value. If you wish to use separate JitterAmounts for X and Y, change the definition of JitterAmount from ‘double’ to ”MATLAB array’ in %matlabroot%/toolbox/matlab/specgraph/@specgraph/@scattergroup/schema.m line 43:
hProp = schema.prop(hClass, 'Jitter', 'on/off'); hProp.Description = 'Enable/disable jittering'; hProp.FactoryValue = 'off'; hProp.Visible = 'off'; markDirtyProp = Lappend(markDirtyProp,hProp); hProp = schema.prop(hClass, 'JitterAmount', 'double'); % Change this, 'double' => 'MATLAB Array' hProp.Description = 'Maximum amount of jitter'; hProp.FactoryValue = .2; hProp.Visible = 'off'; markDirtyProp = Lappend(markDirtyProp,hProp); |
Other hidden properties of scatterplots
For the record, here is a list of the other hidden properties of scatterplot. This list can be retrieved using my getundoc utility:
>> hggroup = scatter(dataX, dataY); >> getundoc(hggroup) ans = ALimInclude: 'on' ApplicationData: [1x1 struct] Behavior: [1x1 struct] CLimInclude: 'on' Dirty: 'clean' EraseMode: 'normal' HelpTopicKey: '' IncludeRenderer: 'on' Initialized: 1 Jitter: 'on' JitterAmount: 0.51 PixelBounds: [0 0 0 0] RefreshMode: 'auto' Serializable: 'on' XLimInclude: 'on' YLimInclude: 'on' ZLimInclude: 'on' |
Of these properties, the following are unique to scatter plots: Dirty, Initialized, Jitter, JitterAmount, RefreshMode. The rest are common to all Handle Graphic objects.
You may also be interested in the article I posted a few years ago about another undocumented scatterplot behavior.


I suspect that the reason the jitter is only in the X direction is that jitter is a (documented) feature for the boxplot command, where the points beyond the whisker can be jittered side-to-side.
Its a pitty, there is no jitter propterty for the “errorbars” plot, becuse I want to create a scatterplot consisting of mean data points.
Any ideas of how to use this jitter functionality with gscatter?
@Jake – gscatter creates
lineobjects, which do not have Jitter properties as inscatterobjects. If you want to use the jitter functionality, use scatter rather than gscatter.