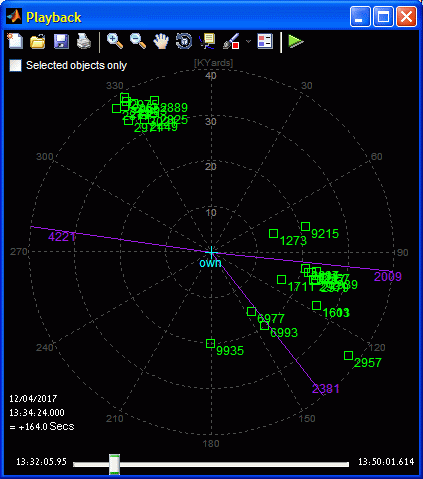
In one of my projects, I needed to present a radar (polar) plot. Such plots are usually drawn on a black background and I wanted all the plot controls to blend into this background.

For the plot itself I used a variation of Matlab’s buggy polar [1] function, which I modified to enable proper dynamic resize / zoom / pan, bypass figure-renderer issues with patches and data-cursors, and other similar annoyances. Pretty standard stuff.
For the slider I’ve used a javax.swing.JSlider [2] having a continuous-movement callback [3]. Again, for readers of this blog this is nothing special:
[jSlider,hSlider] = javacomponent('javax.swing.JSlider',[0,0,.01,0.1],hFig);
set(hSlider, 'Units','norm','pos',[.15,0,.7,.05]);
set(jSlider, 'Background',java.awt.Color.black, ...
             'Value',0, 'Maximum',duration, ...
             'StateChangedCallback',{@cbSlider,hFig,axPlayback});
Setting the background color for all the GUI components to black was easy. But setting the toolbar’s background to black turned out to be a bit more interesting, and is the topic of this week’s article.

The first step, naturally, is to get the toolbar’s handle [4]:
hToolbar = findall(hFig,'tag','FigureToolBar');
In my case, I programmatically create the figure and use the default figure toolbar, whose tag value is always ‘FigureToolBar’. If I had used a custom toolbar, I would naturally use the corresponding tag (for example, if you create a custom toolbar using GUIDE, then the tag name will probably be ‘toolbar1’ or something similar).
Since I’m setting the figure programmatically, I need to manually remove several unuseful toolbar controls. I do this by directly accessing the toolbar control handles [5]:
delete(findall(hToolbar,'tag','Plottools.PlottoolsOn'))
delete(findall(hToolbar,'tag','Plottools.PlottoolsOff'))
delete(findall(hToolbar,'tag','Annotation.InsertColorbar'))
delete(findall(hToolbar,'tag','DataManager.Linking'))
delete(findall(hToolbar,'tag','Standard.EditPlot'))
For setting the bgcolor, we get the toolbar’s underlying Java component [6], then sprinkle some Java magic power:
% ensure the toolbar is visible onscreen
drawnow;
% Get the underlying JToolBar component
jToolbar = get(get(hToolbar,'JavaContainer'),'ComponentPeer');
% Set the bgcolor to black
color = java.awt.Color.black;
jToolbar.setBackground(color);
jToolbar.getParent.getParent.setBackground(color);
% Remove the toolbar border, to blend into figure contents
jToolbar.setBorderPainted(false);
% Remove the separator line between toolbar and contents
jFrame = get(handle(hFig),'JavaFrame');
jFrame.showTopSeparator(false);
Unfortunately, this is not enough. The reason is that some of Matlab’s standard toolbar icons use non-opaque Java button controls (thereby showing the new black bgcolor), whereas other icons use opaque buttons, with a hard-coded gray background (I feel like spanking someone…). I’ve already touched upon this issue briefly [7] a few years ago.

Luckily, all is not lost: we simply need to loop over all the JToolBar’s components and force them to be non-opaque with a black bgcolor. In cases where the component is compound (e.g., the Brush Data uisplittool [8]), we need to set the bgcolor for all the sub-components:
jtbc = jToolbar.getComponents;
for idx=1:length(jtbc)
    jtbc(idx).setOpaque(false);
    jtbc(idx).setBackground(color);
    for childIdx = 1 : length(jtbc(idx).getComponents)
        jtbc(idx).getComponent(childIdx-1).setBackground(color);
    end
end
…finally ending up with the blended appearance that appears at the top of this article.
6 Comments To "Customizing figure toolbar background"
#1 Comment By Zheng Liu On March 12, 2013 @ 06:41
Hi Yair:
Thank you for your contribution, it is an excellent work, if my figure is a GUI (created by GUIDE), how should I change my customized Toolbar’s backgroundcolor? suppose my Toolbar’s Tag is uitoolbar1, thank you very much.
#2 Comment By Yair Altman On March 12, 2013 @ 14:34
@Zheng – follow the steps outlined in the article, simply modify
to:
in your *_OutputFcn() function that is generated by GUIDE.
The rest of the code in my article should follow this line (use
handles.hObjectwherever it sayshFigin my article).#3 Comment By Zheng Liu On March 15, 2013 @ 08:13
Dear Yair, thank you very much for your timely reply, your suggestion gave me a very critical help, wish you good luck.
#4 Comment By Zheng Liu On March 15, 2013 @ 18:57
Dear Yair:
I put the two techniques ( [15] and [16]) designed by you together, I hope to change the background while floating the toolbar, this effect has been achieved in function, but there are a few small issues to be resolved, the questions are as follows:
(1) How should I do to specify the location of the toolbar while floating? unfortunately, my way (
jTbar.getUI.setFloating(true,java.awt.Point(0,0));) does not work;(2) How should I do to control the emergence and disappear of the toolbar via right-click menu(for example attached to the current GUI figure)? I currently take a drag-and-off style.
Yours Sincerely.
My code (in the “*_OutputFcn()” that is generated by GUIDE) is as follows:
% --- Outputs from this function are returned to the command line.
function varargout = toolbar_demo_OutputFcn(hObject, eventdata, handles)
% varargout  cell array for returning output args (see VARARGOUT);
% hObject    handle to figure
% eventdata  reserved - to be defined in a future version of MATLAB
% handles    structure with handles and user data (see GUIDATA)

% Get default command line output from handles structure
varargout{1} = handles.output;
jTbar = get(get(findall(handles.figure_main,'tag','uitoolbar1'),'JavaContainer'),'ComponentPeer');
color = java.awt.Color.red;
jTbar.setBackground(color);
jTbar.getParent.getParent.setBackground(color);
jtbc = jTbar.getComponents;
for idx=1:length(jtbc)
    jtbc(idx).setOpaque(false);
    jtbc(idx).setBackground(color);
    for childIdx = 1 : length(jtbc(idx).getComponents)
        jtbc(idx).getComponent(childIdx-1).setBackground(color);
    end
end
jTbar.setBorderPainted(false);
jFrame = get(handle(handles.figure_main),'JavaFrame');
jFrame.showTopSeparator(false);
jTbCon = jTbar.getParent;
jLayout = java.awt.FlowLayout(0,0,0);
jTbar.setLayout(jLayout);
jTbar.setFloatable(true);
jTbar.getUI.setFloating(true,java.awt.Point(0,0));
jCpts = jTbar.getComponents;
for i = 1 : length(jCpts)
    jMls = jCpts(i).getMouseListeners;
    for j = 1 : length(jMls)
        if ~isempty(strfind(get(jMls(j),'type'),'FlyOverListener'))
            jCpts(i).removeMouseListener(jMls(j))
            jCls = jCpts(i).getChangeListeners;
            if ~isempty(strfind(get(jCls(1),'type'),'FlyOverListener'))
                jCpts(i).removeChangeListener(jCls(1))
            end
        end
    end
end
hjTbar = handle(jTbar,'CallbackProperties');
dockUndockCallbackFcn(hjTbar,1,jTbCon)
set(hjTbar,'AncestorAddedCallback',{@dockUndockCallbackFcn,jTbCon});

function dockUndockCallbackFcn(src, ~, jTbc)
if src.isFloating
    jWin = src.getTopLevelAncestor;
    jWin.setResizable(true)
    jWin.setPreferredSize(java.awt.Dimension(450,57));
    jWin.setSize(java.awt.Dimension(450,57));
    jTbc.setVisible(false)
    set(jWin,'WindowClosingCallback',@(~,~)jTbc.setVisible(true))
end
#5 Comment By masi On October 17, 2016 @ 20:54
Which polar coordinate system did you use for your solution in MATLAB 2013?
I am trying to integrate your code to MATLAB 2016b `polaraxes` + `warp` in the thread here [17]
#6 Comment By Yair Altman On October 18, 2016 @ 01:33
I used a standard radar-plot layout: North is up (0/360 degs); South is down (180 degs); degrees increasing clockwise from top (North pole).