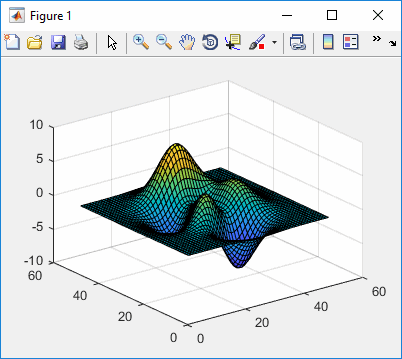
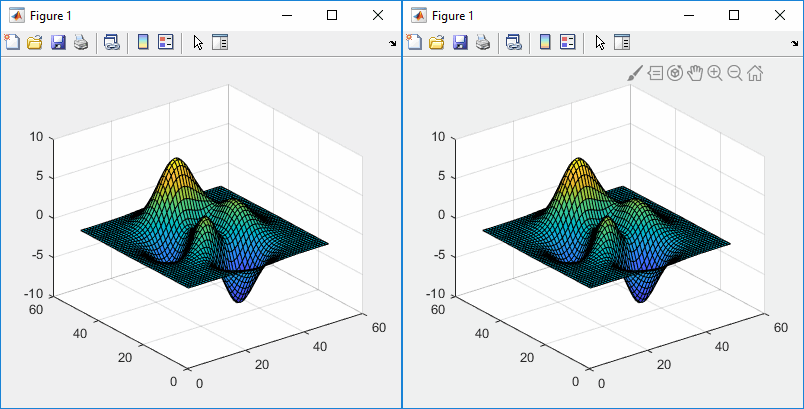
I planned to post a new article in my toolstrip mini-series, but then I came across something that I believe has a much greater importance and impacts many more Matlab users: the change in Matlab R2018b’s figure toolbar, where the axes controls (zoom, pan, rotate etc.) were moved to be next to the axes, which remain hidden until you move your mouse over the axes. Many users have complained about this unexpected change in the user interface of such important data exploration functionality:


Luckily, we can revert the change, as was recently explained in this Answers thread:
addToolbarExplorationButtons(gcf) % Add the axes controls back to the figure toolbar hAxes.Toolbar.Visible = 'off'; % Hide the integrated axes toolbar %or: hAxes.Toolbar = []; % Remove the axes toolbar data |
And if you want to make these changes permanent (in other words, so that they would happen automatically whenever you open a new figure or create a new axes), then add the following code snippet to your startup.m file (in your Matlab startup folder):
try %#ok if ~verLessThan('matlab','9.5') set(groot,'defaultFigureCreateFcn',@(fig,~)addToolbarExplorationButtons(fig)); set(groot,'defaultAxesCreateFcn', @(ax,~)set(ax.Toolbar,'Visible','off')); end end |
MathWorks is taking a lot of heat over this change, and I agree that it could have done a better job of communicating the workaround in placing it as settable configurations in the Preferences panel or elsewhere. Whenever an existing functionality is broken, certainly one as critical as the basic data-exploration controls, MathWorks should take extra care to enable and communicate workarounds and settable configurations that would enable users a gradual smooth transition. Having said this, MathWorks does communicate the workaround in its release notes (I’m not sure whether this was there from the very beginning or only recently added, but it’s there now).
In my opinion the change was *not* driven by the marketing guys (as was the Desktop change from toolbars to toolstrip back in 2012 which received similar backlash, and despite the heated accusations in the above-mentioned Answers thread). Instead, I believe that this change was technically-driven, as part of MathWorks’ ongoing infrastructure changes to make Matlab increasingly web-friendly. The goal is that eventually all the figure functionality could transition to Java-script -based uifigures, replacing the current (“legacy”) Java-based figures, and enabling Matlab to work remotely, via any browser-enabled device (mobiles included), and not be tied to desktop operating systems. In this respect, toolbars do not transition well to webpages/Javascript, but the integrated axes toolbar does. Like it or not, eventually all of Matlab’s figures will become web-enabled content, and this is simply one step in this long journey. There will surely be other painful steps along the way, but hopefully MathWorks would learn a lesson from this change, and would make the transition smoother in the future.
Once you regain your composure and take the context into consideration, you might wish to let MathWorks know what you think of the toolbar redesign here. Please don’t complain to me – I’m only the messenger…
Merry Christmas everybody!
p.s. One of the complaints against the new axes toolbar is that it hurts productivity by forcing users to wait for the toolbar to fade-in and become clickable. Apparently the axes toolbar has a hidden private property called FadeGroup that presumably controls the fade-in/out effect. This can be accessed as follows:
hFadeGroup = struct(hAxes.Toolbar).FadeGroup % hAxes is the axes handle |
I have not [yet] discovered if and how this object can be customized to remove the fade animation or control its duration, but perhaps some smart hack would discover and post the workaround here (or let me know in a private message that I would then publish anonymously).


my comment to Mathworks on this subject was “the least user-friendly update Mathworks has released in the last 15 years…”
Yair – thanks as always for escalating this issue, and for helping others find a way through to get behavior they are looking for. Rest assured the team is digging in to the feedback to figure out the best approach to addressing concerns.
One thing puzzles me about the whole conversation (esp. on MTLAB Answers). Nobody is mentioning the default axes interactions, which we introduced along with the axes toolbar. We actually felt this was the biggest breakthrough, because you don’t need to interact with the toolbar at all in order to zoom, pan, rotate, or add datatips to a chart. Any thoughts on this? There’s a huge banner on the figure in 18b that introduces these new gestures so we thought people would find them.
I also can clarify a couple of things from your post:
* The Toolstrip was not driven by the marketing guys (and gals!). It was very much driven by our interest in improving discoverability of key capabilities which were too buried in menus and toolbars.
* The axes toolbar was not created primarily to support the move to web graphics. We intended it to be a solution to multiple problems:
** The toolbar for a figure docked in the desktop can be very far from the figure itself.
** We’d like to move towards being able to define interactions at the axes level, instead of the figure level, since interactions are axes specific. The axes toolbar is one step in that direction
@Michelle – thanks for your comment. The fact that I failed to mention the new built-in mouse interactions is my mistake – I originally planned to include it in the post, but then I forgot about it as I was writing the text. For the record, I find it intuitive and extremely useful, to the point of asking myself how come nobody thought of it until now. It certainly alleviates part of the pain of the toolbar change.
One thing that I slightly disliked in the new built-in interactions was the fact that the data-tip text is black when you just hover and move the mouse, and then turns blue when you click to pin the data-tip. Maybe I’ll get used to this over time, but it seemed weird for me.
I stand corrected regarding the inner reasoning for changes in the toolbar and toolstrip. Readers might not be aware of this but this is a good time to point out that I never write about anything to which I have access to confidential internal information. In other words, whatever I write is based solely on speculation, inference, my digs within open source code, and common sense. Sometimes, hopefully not too often, I come to mistaken conclusions. I apologize if anyone gets hurt. My aim is never malice.
Your points about the reasoning for the axes toolbar changes are well noted and certainly make sense. The direction is good, it’s just that I think you made two steps at once (adding the axes toolbar, and removing the figure-level controls) and that’s one step too many. I think the new axes toolbar would have been a very welcome addition if it was offered in addition to the same functionality in the figure toolbar, not as a replacement. Then in a follow-on release you could have removed the figure-level controls (leaving a configurable way to return them) and it would have made much less noise because by then people would have gotten used to the built-in mouse interactions and the axes toolbar.
Separately, I think a few things could be improved in the axes toolbar:
* performance – the lag due to the fade-in effect, which cannot be controlled [AFAIK]
* users need to move the mouse over the axes just to see the location of the axes control, requiring extra mouse moves/clicks. This could be corrected by having a fade-out opacity not to 0% but to 5-10% – users would then be able to directly click the controls, without it being too obtrusive (don’t forget to hide it altogether upon figure copy or export)
* the new export control has no option to export as vector formats EPS/SVG/EMF, nor to the clipboard or printer. I think these would be welcome additions that should not be too difficult to implement.
Nobody is mentioning the default axes interactions, which we introduced along with the axes toolbar. We actually felt this was the biggest breakthrough, because you don’t need to interact with the toolbar at all in order to zoom, pan, rotate, or add datatips to a chart. Any thoughts on this?
Personally, I do like the ability to zoom in with the mouse wheel and to pan without additional clicks. However, I constantly found myself still using my own simple custom hotkeys, as before. AFAIU, some things (e.g. creating multiple datatips) cannot be performed without explicitly switching to a specific cursor mode.
Also, I do agree with Yair, David, Bruno and others that making the axis toolbar completely invisible when “not needed” was a bad idea. Yair’s suggestion to keep it at least partially visible is great. But I’m not sure if 5% would be enough.
——————–
There’s a huge banner on the figure in 18b that introduces these new gestures so we thought people would find them.
Banner? Personally, I don’t remember any. Is there a list of the gestures available or something?
Thanks Yair and Igor for the additional input. I’m finding this really helpful to drill down into the specific issues, and will make sure the team sees your suggestions.
Igor – the banner appeared on figures in 18b. I’m guessing you dismissed it the first time without much thought, then it wouldn’t pop up again. This is a common issue with banners. The banner explains the gestures, which are also listed in the documentation: https://www.mathworks.com/help/matlab/creating_plots/interactively-explore-plotted-data.html
I actually really like how we can interact with plots in 2018b and 2019a. I often develop GUIs for end-users and deactivate the standard Matlab figure toolbar all together (opposite to most other people that now miss part of the standard figure toolbar). Problem in my case is that I don’t get the default axes interactions unless I do things in the right order, i.e. I have run enableDefaultInteractivity after something is plotted in the axes otherwise data tips etc. are not active, see below. I don’t know why and I did not find this documented anywhere.
There are other issues with going all-in with regard to the new possibilities that Matlab offers in 2019a. For example
1. Why do pcolor objects not come with a DataTipTemplate? plot does, even surf does. Makes it difficult to develop applications that have a consistent user interaction.
2. The DataTipTemplate gives nice possibilities to improve data exploration. But when I assign them to all the objects on my GUIs the plot/refresh times are doubled. The performance of Matlab is crucial for most of us. So, please only introduce features once it is clear that they do not affect performance significantly. It is not fair to us users to introduce these features and we then rewrite code just to figure out in the end that we just created a snail and wasted lots of our development time.
So, please Mathworks:
– document better
– make things consistent
– check performance before releasing new features
(and why we in 2019 still have to beg that you introduce export to clipboard – axtoolbar, as already stated by Yair above – is not understandable)