During my work on the recent series of articles on undocumented Profiler options [1], I came across a very odd bug. Apparently, a major documented Profiler functionality has been dysfunctional since at least R2008a (and probably earlier), and AFAIK was not reported until now.
The functionality in question is the Profiler’s documented ability to display results in either wall-clock (profile -timer real) or CPU-time (profile -timer cpu) modes. In fact, at least since R2008a and possibly sooner (I’m unsure about earlier releases), at least on Windows (I’m unsure about other platforms), both of these Profiler options provide wall-clock measurements – CPU-time measurements is not available. The irony is that CPU mode is stated in the documentation [2] to be the Profiler’s default mode, and has been this way ever since this option was introduced about a decade ago.
I used a very simple test harness – prepare the following function in test.m:
function test
    pause(2)
end
And now run it in the Profiler:
>> profile on -timer cpu
>> test
>> profile off; profile report
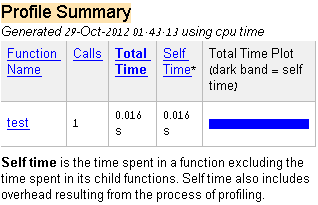
If everything had worked as documented, the Profiler report would show the test function as taking no time at all, or maybe only a few millisecs of overhead. In fact, this is exactly what we see in Matlab release R14 SP3 (7.1, dated 2005):

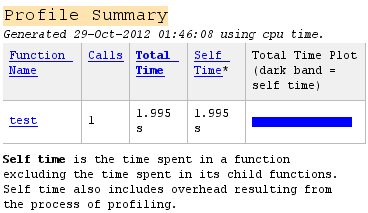
Unfortunately, on R2008a and later (and possibly also some earlier releases), the same profiling run reports the timing as taking 2 full seconds (=wall-clock time):

You might assume that the built-in pause function has a bug that causes it to churn the CPU, and in that case the Profiler’s report would be correct. However, a quick check in the Task Manager (I actually use Process Explorer [3] that I find much better) proves that this is not the case – no discernible CPU-time is used by the Matlab process during the pause.
Somewhere between R2006a and R2008a a bug was introduced that caused the Profiler to only use wall-clock mode.
Note that even in R14 SP3 the situation is not perfect: I have found that the default mode (i.e., when not specifying the -timer mode explicitly) is sometimes wall-clock and sometimes CPU, with no apparent consistency. However, if we explicitly use the -timer option, it works ok.
It is strange that such a feature has escaped everyone’s attention (the community’s no less than MathWorks’) for so many years. It is true that this is not an often-used functionality, and it is also true that the profile function itself it way under-utilized by the general public. Still, anyone who needs to do serious performance tuning must have used this feature at some point in time. When performance-tuning code, it is very important to be aware of both the wall-clock and the CPU-time of the profiled program. Different tuning strategies apply to these two modes. Relying only on wall-clock timing can lead to incorrect conclusions about the application’s hotspots, and therefore to sub-optimal tuning. So I am very surprised that this bug was not reported until now. I’ve reported it (1-K1I06V) lately, and I really hope that it will be fixed in R2013a.
6 Comments To "Buggy Profiler option"
#1 Comment By Malcolm Lidierth On November 4, 2012 @ 11:00
From the command line:
works as expected giving:
No profile information to display.But making test.m a script gives the same result as the function.
#2 Comment By Eric S On December 11, 2012 @ 13:22
Yair, from what I remember hearing from a TMWer, the ability to measure CPU time has become more and more meaningless over time as things such as hyperthreading, complex pipelining, and multi-core/CPU technologies have been developed. I wouldn’t be surprised if CPUTIME went away in a future version (or just returned wall time), and the same thing could happen with the profiler. See the note at the end of the following doc page: [10]
Maybe you could post a question on CSSM or email one of the blog owners to see if they can clarify all of this 🙂
#3 Comment By Yair Altman On December 11, 2012 @ 14:06
@Eric – I think that even in a modern environment there can be a use for both CPU and wall clock profiling: The former highlights algorithmic hotspots, whereas the latter highlights I/O hotspots, for example.
As for your suggestion to fish for clarifications via CSSM/blogs, there was actually a recent [11] that posted on the same day as my article (a pure coincidence – I usually prepare my articles several days before posting). Anyway, that CSSM thread did not get a response from any MathWorker. This blog has very high visibility at TMW, so all the relevant people there are now well aware of my post. No official response was given here, not because they are not aware of this, but because they chose not to do so. You shouldn’t read too much into this – there can be numerous reasons why they chose not to respond (in fact, they do respond very rarely here, but not for lack of interest).
#4 Comment By Eric S On December 12, 2012 @ 10:17
Thanks Yair – but what I remember hearing was that technically, being able to measure CPU time has become more challenging (or maybe not possible accurately?). Maybe this was specific to Windows? Either way I’m trying to remember a conversation from 5 years ago, so you’ll have to excuse my rustiness 🙂
Cheers
#5 Comment By Dan S. On December 12, 2012 @ 23:52
On 64-bit linux “-timer cpu” and “-timer real” are definitely different. I recently found the default “-timer cpu” to be somewhat uselessly unpredictable on a quad-core cpu on linux, and verified the same issues back at least to 2010a. Slight changes in the code would show up as major profile differences on lines before the change, and profiled times often disagreed with tic/toc too substantially to make any sense. According to the mathworks rep it was at least partly because I profiled a script rather than a function, although why this should be was not explained. I’ve used the default timer for years, but no more.
#6 Comment By Tim Holy On December 15, 2012 @ 03:23
At least as of 2011 (and may still be true), perhaps the biggest difference between the CPU and wall clock options is how they handle multithreading. It seems that CPU time does something along the lines of summing the time spent by all processors. On systems with many CPUs, this can be pretty confusing: for example, I’ve found that it’s possible to come to the conclusion that repmat is faster than bsxfun, which I’ve never found to be true in reality.
Switching to wall time is now one of my startup.m settings.