The Matlab profiler is a powerful tool for debugging performance-related issues in Matlab applications. However, it also has some undocumented options that facilitate other forms of debugging, namely memory bottlenecks and JIT (Just-In-Time compilation) problems.
To turn on memory stats in the profile report, run this (only once is necessary – will be remembered for future profiling runs):
profile -memory on;
profile('-memory','on');  % an alternative
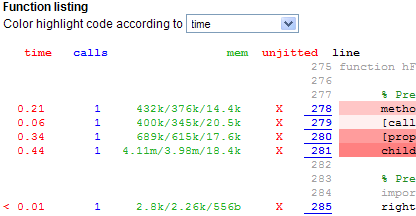
To turn on JIT information, run this (again, only once is necessary, prior to profile report):
setpref('profiler','showJitLines',1);
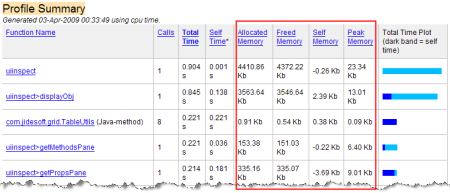
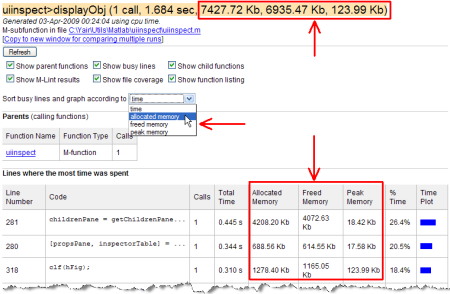
You will then see additional JIT and memory (allocated, freed and peak) information displayed in the profile report, as well as the options to sort by allocated, freed and peak memory:


For those interested, the references to these two options appear within the code of profview.m (line 1199 on R2007b), for the JIT option:
showJitLines = getpref('profiler','showJitLines',false);
…and profile.m (lines 163-165 on R2007b), for the memory option:
if memory ~= -1
    callstats('memory', memory);
end
Note that there appears to be two undocumented additional memory-related options in profile.m (lines 311-312):
options = {'detail', 'timer', 'history', 'nohistory', 'historysize', ...
           'timestamp', 'memory', 'callmemory', 'nomemory' };
However, ‘-nomemory’ appears to simply turn the memory stats collection off, and ‘-callmemory’ is not recognized because of a bug in line 349, which looks for ‘callnomemory’…:
    case 'callnomemory'   % should be 'callmemory'
           memory = 2;
When this bug is fixed, we see that we get only partial memory information, so the ‘-callmemory’ option is really not useful – use ‘-memory’ instead.
Addendum (Jan 31, 2011): JIT information has been removed in Matlab 7.12 (R2011a). I assume that this was done so that programmers will not attempt to depend on JITC functionality in their code (see Michelle Hirsch’s comment below). It’s a good thing that the memory options remain, since these are quite useful in profiling memory-related bottlenecks.


Yair –
Thanks for another interesting post. I’d like to share a couple of comments:
– We would love feedback on the memory profiling feature. We know there’s a lot of interest in tools to help figure out where and how memory is chewed up in code, but it turns out to be not so obvious as to what information to present and how. I’ll keep an eye out here for comments, or readers can feel free to email me directly. My address is on my MATLAB Central page.
– I would advise a bit of caution when working with the JIT profiler results. We turned them off after MATLAB 6.5 primarily because the JIT was such a moving target (changing every release) that we really didn’t want to encourage users to code against it. That being said, your readers all know the standard warning that comes with your posts – so have fun poking around!!
Yair
This is rapidly becoming one of my favourite blog sites. keep up the excellent work.
Mark
Profiling the memory sounds really interresting – unfortunately it does NOT work on my computer (Win XP, Maltab R2009a)
Marcel
[…] I have recently discussed undocumented features in Matlab’s built-in profiler. Another tool often used for ad-hoc performance profiling of Matlab code are the built-in duo functions tic and toc […]
Good Work
It doesn’t work for me in 2007B, OS X 10.5. It gives me the following error from callstats.m: “Support for memory tracking is not available with the current memory manager.
This is unfortunate, because lack of memory profiling is one of Matlab’s biggest performance gaps. As someone who works with massive neuroimaging data sets every day, good memory use is more important to me than CPU performance. Shaving an hour or two off an analysis is nice, but using too much memory means my analysis won’t even finish.
As an ex-professional programmer, I’d seriously considered making and selling something like this as an add-on if I wasn’t in grad school.
Maybe in that far-off utopia of infinite funding, I can convince my advisors to buy all the necessary copies of later matlab versions. 🙂
@Matthew – please read Scott Hirsch’s comment above. Scott is the Matlab product manager at MathWorks and says that they “would love feedback on the memory profiling feature”. Perhaps you could contact him via the attached link and explain your use-case. There might be a workaround for your Matlab version/platform. Even if not, it might benefit other users who have similar issues. If you learn anything new, please do post it here.
Works great over here, although sometimes gives nonsensical values for memory consumption (negative amounts or terabytes, etc.). Linux 64-bit R2009b.
Memory profiling is great, but it does seem to add a lot of overhead, potentially slowing the profiler by many orders of magnitude.
The -memory option is a great idea. But as @DA states above it can really slow the profiler down. I had to turn it off, with the -nomemory option, to get reasonable performance.
Does this work correctly on Linux?
I got a nonsensical memory value for a mex function (10^16 kB). It is using its own memory allocation internally, though…
[…] Matlab Profiler’s undocumented memory profiling option helped me quite a bit, as well as lots of intuition and trial-and-error. Detecting memory leak is never easy […]
[…] the Matlab Profiler enables monitoring memory usage […]
[…] Three years ago I published an article on undocumented profiler options. Since then, I have posted several articles about performance […]
[…] Past articles explained how to profile memory, improve timing resolution and fix a font issue […]
[…] Past articles explained how to profile memory, improve timing resolution and fix a font issue, and display the call history. […]
[…] However interp3 is VERY memory intensive. Here are example MATLAB profiler outputs illustrating the peak memory used by MATLAB (note that I used the undocumented MATLAB profiler memory option “profile -memory on;”, described here): […]
Hi Yair,
Can you explain a little more how you used the profiler to detect leaks? I’m working on a continuously running software (always open, but runs a set of functions/methods every minute or so) that seems to creep up in memory over time. I ran the profiler while executing my code and am trying to understand what I’m looking at. I see allocated, freed, self, and peak memory, but don’t know how that translates to memory growth over time. Any help would be appreciated!
@Andrew – it should be relatively easy to see where allocated>freed: when there are no leaks, these two should have exactly the same value.
You could also use non-Matlab tools (e.g., Process Explorer for memory leaks or GDIView for GDI handle leaks — both of them for Windows).
Note in advance that hunting down memory leaks in Matlab is very difficult, due to the lack of good monitoring tools (AFAIK).
If you or anyone else find any leaks, please report them here or directly to me. I know for a fact that MathWorks’ dev team are very interested in such inputs — whatever will be reported to me I will pass on to them for fixing.
Hi Yair,
That’s what I figured, but I thought I would ask for clarification anyway. Thanks so much for your quick response and wealth of knowledge! It seems a bit strange. I can run the same set of functions with the same inputs, but the profiler comes back with different results. And I’ll need to determine if it’s my code or Matlab itself causing the memory growth… Well, I will certainly let you know what I can come up with.
Thanks again!
~Andrew
[…] However interp3 is VERY memory intensive. Here are example MATLAB profiler outputs illustrating the peak memory used by MATLAB (note that I used the undocumented MATLAB profiler memory option “profile -memory on;”, described here): […]
Hi dear Yair
i want to know differences between peak memory, self memory, allocated memory and freed memory while we are using Memory monitoring using profiler.
i google it but it seems no one knows about the issue!
thanks in advance.
@Jabbar – I believe that these are an approximate description of the various reported values:
* Peak memory is the maximal amount of allocated memory during the execution of the profiled line/function.
* Allocated memory is the total amount of memory allocated during the execution. Note that it is a cumulative amount, meaning that if you have an allocation of 1KB in a loop that runs 50 times, you’ll see a 50KB value.
* Freed memory is the total amount of memory de-allocated during the execution. This too is a cumulative amount.
* Self memory is the memory used by the profiled line/function, which is not deallocated (and therefore not included in the “Freed memory” value).
Note that these are speculations: The exact definition of what is reported under which category is internal to Matlab and is currently unknown.