Undocumented Matlab
  • SERVICES
    • Consulting
    • Development
    • Training
    • Gallery
    • Testimonials
  • PRODUCTS
    • IQML: IQFeed-Matlab connector
    • IB-Matlab: InteractiveBrokers-Matlab connector
    • EODML: EODHistoricalData-Matlab connector
    • Webinars
  • BOOKS
    • Secrets of MATLAB-Java Programming
    • Accelerating MATLAB Performance
    • MATLAB Succinctly
  • ARTICLES
  • ABOUT
    • Policies
  • CONTACT

Undocumented Profiler options part 2

September 19, 2012 One Comment

Three years ago I published an article on undocumented profiler options. Since then, I’ve posted several articles about performance tuning and profiling (for example, memory profiling) but nothing specifically about the Profiler. There are several additional undocumented aspects of the Profiler that I’d like to expose. Today’s article will focus on benefits that require a bit of tweaking to Matlab files (fixing a font issue and increasing the reported time resolution). Next week’s article will explain undocumented switches of the profile function, which can be used to profile built-in functions, as well as to provide detailed history timeline of the function calls.

Fixing a Profiler font problem

On my system, starting in R2012a, the code lines in the detailed profiling report look awful. The reason is that they are rendered using a proportional font, rather than the monospaced (fixed-width) font that is specified in the Matlab Preferences and used everywhere else (the Editor, Command Window etc.):
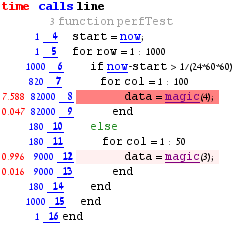
Before: ugly (proportional-font) profiling report


I have seen this phenomenon on several of my clients’ systems, so I’m pretty sure that this is not an isolated issue. However, I do not know whether this problem is wide-spread.
In any case, the solution is very simple: Edit the %matlabroot%/toolbox/matlab/codetools/matlab-report-styles.css files and replace the following CSS directives near the top of the file:

PRE {
  font-size: 100%;
}

PRE { font-size: 100%; }

with this one:

pre, tt {
  font-family: monospace
  font-size: 100%;
}

pre, tt { font-family: monospace font-size: 100%; }

After: monospaced profiling report
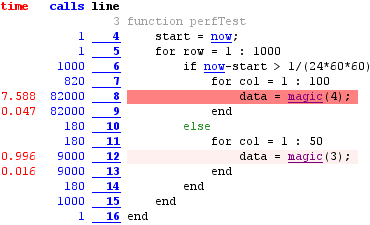
(note the 1-millisecond timing resolution)

A very similar problem seems to afflict the Help browser. I could not add the CSS fix there because the help pages use the docstyle.css files that are bundled within the \help\techdoc\help.jar file. If you wish, you could update them there (a JAR is a simple zip file after all).
You may perhaps recall my related article last year, where I showed how to convert a proportional-font multi-line tooltip into a nicely-formatted monospaced tooltip.

Increasing the reported timing resolution

The Profiler records information at a system-dependent time resolution, typically 1 millisecond. However, the profiling report only displays information at a granularity of 10 ms. I often find it useful to increase the reported resolution to 1 ms, and in fact the screenshots above reflect this change. This can easily be done by editing the profview function (%matlabroot%/toolbox/matlab/codetools/profview.m. This function can be edited in the MATLAB editor via edit(‘profview’)).
The following is from lines 1410-1418 of profview.m in R2012a:

% Display the time
if timePerLine > 0.01,
    s{end+1} = sprintf('<span style="color: #FF0000"> %5.2f </span>',...
        timePerLine);
elseif timePerLine > 0
    s{end+1} = '<span style="color: #FF0000">&lt; 0.01 </span>';
else
    s{end+1} = '       ';
end

% Display the time if timePerLine > 0.01, s{end+1} = sprintf('<span style="color: #FF0000"> %5.2f </span>',... timePerLine); elseif timePerLine > 0 s{end+1} = '<span style="color: #FF0000">&lt; 0.01 </span>'; else s{end+1} = ' '; end

which could be replaced by the following (modified lines highlighted):

if timePerLine >= 0.005,    s{end+1} = sprintf('<span style="color: #FF0000"> %6.3f</span>',...        timePerLine);
elseif timePerLine > 0
    s{end+1} = '<span style="color: #FF0000">&lt; 0.005</span>';else
    s{end+1} = '       ';
end

if timePerLine >= 0.005, s{end+1} = sprintf('<span style="color: #FF0000"> %6.3f</span>',... timePerLine); elseif timePerLine > 0 s{end+1} = '<span style="color: #FF0000">&lt; 0.005</span>'; else s{end+1} = ' '; end

Related posts:

  1. Undocumented profiler options – The Matlab profiler has some undocumented options that facilitate debugging memory bottlenecks and JIT (Just-In-Time Java compilation) problems....
  2. Undocumented Profiler options part 4 – Several undocumented features of the Matlab Profiler can make it much more useful - part 4 of series. ...
  3. Undocumented Profiler options part 3 – An undocumented feature of the Matlab Profiler can report call history timeline - part 3 of series. ...
  4. Buggy Profiler option – a bug exists in the profiler that prevents usage of its documented CPU timing functionality. ...
  5. tic / toc – undocumented option – Matlab's built-in tic/toc functions have an undocumented option enabling multiple nested clockings...
  6. More undocumented timing features – There are several undocumented ways in Matlab to get CPU and clock data...
Performance Profiler Pure Matlab
Print Print
« Previous
Next »
One Response
  1. Undocumented Profiler options part 4 | Undocumented Matlab October 3, 2012 at 15:07 Reply

    […] Past articles explained how to profile memory, improve timing resolution and fix a font issue, and display the call history. […]

Leave a Reply
HTML tags such as <b> or <i> are accepted.
Wrap code fragments inside <pre lang="matlab"> tags, like this:
<pre lang="matlab">
a = magic(3);
disp(sum(a))
</pre>
I reserve the right to edit/delete comments (read the site policies).
Not all comments will be answered. You can always email me (altmany at gmail) for private consulting.

Click here to cancel reply.

Useful links
  •  Email Yair Altman
  •  Subscribe to new posts (email)
  •  Subscribe to new posts (feed)
  •  Subscribe to new posts (reader)
  •  Subscribe to comments (feed)
 
Accelerating MATLAB Performance book
Recent Posts

Speeding-up builtin Matlab functions – part 3

Improving graphics interactivity

Interesting Matlab puzzle – analysis

Interesting Matlab puzzle

Undocumented plot marker types

Matlab toolstrip – part 9 (popup figures)

Matlab toolstrip – part 8 (galleries)

Matlab toolstrip – part 7 (selection controls)

Matlab toolstrip – part 6 (complex controls)

Matlab toolstrip – part 5 (icons)

Matlab toolstrip – part 4 (control customization)

Reverting axes controls in figure toolbar

Matlab toolstrip – part 3 (basic customization)

Matlab toolstrip – part 2 (ToolGroup App)

Matlab toolstrip – part 1

Categories
  • Desktop (45)
  • Figure window (59)
  • Guest bloggers (65)
  • GUI (165)
  • Handle graphics (84)
  • Hidden property (42)
  • Icons (15)
  • Java (174)
  • Listeners (22)
  • Memory (16)
  • Mex (13)
  • Presumed future risk (394)
    • High risk of breaking in future versions (100)
    • Low risk of breaking in future versions (160)
    • Medium risk of breaking in future versions (136)
  • Public presentation (6)
  • Semi-documented feature (10)
  • Semi-documented function (35)
  • Stock Matlab function (140)
  • Toolbox (10)
  • UI controls (52)
  • Uncategorized (13)
  • Undocumented feature (217)
  • Undocumented function (37)
Tags
ActiveX (6) AppDesigner (9) Callbacks (31) Compiler (10) Desktop (38) Donn Shull (10) Editor (8) Figure (19) FindJObj (27) GUI (141) GUIDE (8) Handle graphics (78) HG2 (34) Hidden property (51) HTML (26) Icons (9) Internal component (39) Java (178) JavaFrame (20) JIDE (19) JMI (8) Listener (17) Malcolm Lidierth (8) MCOS (11) Memory (13) Menubar (9) Mex (14) Optical illusion (11) Performance (78) Profiler (9) Pure Matlab (187) schema (7) schema.class (8) schema.prop (18) Semi-documented feature (6) Semi-documented function (33) Toolbar (14) Toolstrip (13) uicontrol (37) uifigure (8) UIInspect (12) uitools (20) Undocumented feature (187) Undocumented function (37) Undocumented property (20)
Recent Comments
  • Yair Altman (1 day 2 hours ago): Ren – This is usually the expected behavior, which avoids unnecessary duplications of the Excel process in CPU/memory. If you want to kill the process you can always run...
  • Yair Altman (1 day 16 hours ago): When you use plot() without hold(‘on’), each new plot() clears the axes and draws a new line, so your second plot() of p2 caused the first plot() line (p1) to be...
  • Cesim Dumlu (7 days 23 hours ago): Hello. I am trying to do a gradient plot for multiple functions to be displayed on the same axes and each one is colorcoded by respective colordata, using the same scaling. The...
  • Yair Altman (16 days 2 hours ago): @Veronica – you are using the new version of uitree, which uses HTML-based uifigures, and my post was about the Java-based uitree which uses legacy Matlab figures. For...
  • Veronica Taurino (16 days 2 hours ago): >> [txt1,txt2] ans = ‘abrakadabra’
  • Veronica Taurino (16 days 3 hours ago): Hello, I am just trying to change the uitree node name as you suggested: txt1 = 'abra'; txt2 = 'kadabra'; node.setName([txt1,txt2]); >> "Unrecognized method, property, or...
  • Yair Altman (19 days 3 hours ago): The version of JGraph that you downloaded uses a newer version of Java (11) than the one that Matlab supports (8). You need to either (1) find an earlier version of JGraph that...
  • mrv (19 days 7 hours ago): hello, I used MATLAB 2019b update9, I have add jgraphx.jar to javaclassapth, and restart matlab, but still got errors below: Warning: A Java exception occurred trying to load the...
  • xuejie wu (43 days 3 hours ago): Hi: I’m wondering if i can add my customized section or tab ?
  • Yair Altman (54 days 19 hours ago): @Sagar – use the view(az,el) function to rotate the 3D axes.
  • Sagar Chawla (54 days 19 hours ago): I want to know how to change the x-axis to the z-axis. I mean the position. Like if there is a 3d animated graph then how to change position of the axis. X-axis in place of...
  • Ren (54 days 20 hours ago): I noticed that xlsread will create a hidden and never-dying special server that always has priority when actxGetRunningServer is called. So this cause a problem that no matter how many...
  • Ben Abbott (58 days 10 hours ago): Thanks Yair, it was the second. I didn’t not include the drawnow ()
  • Yair Altman (58 days 14 hours ago): @Ben – it looks perfectly ok (with color gradient and all) on my R2022a… Perhaps you missed some of the steps (e.g. setting the ColorBinding to 'interpolated') or...
  • Ben Abbott (58 days 14 hours ago): The graded color is not working for me using R2021a. The plot “HG2 plot line color, transparency gradient” looks exactly like “Transparent HG2 plot...
Contact us
Undocumented Matlab © 2009 - Yair Altman
This website and Octahedron Ltd. are not affiliated with The MathWorks Inc.; MATLAB® is a registered trademark of The MathWorks Inc.
Scroll to top