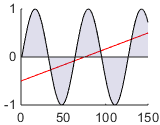
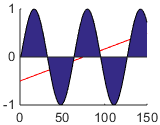
Several months ago, I showed how we can set semi- and fully-transparent colors in HG2 (Matlab’s new graphics engine, starting in R2014b) for multiple graphic objects, including plot lines [1], plot markers [2], and area charts [3]:
hLine = plot([0,150], [-0.5,0.5], 'r');
box off; hold on;
ydata = sin(0:0.1:15);
hArea = area(ydata);
drawnow; pause(0.05);  % this is important!
hArea.Face.ColorType = 'truecoloralpha';
hArea.Face.ColorData(4) = 40;  % 40/255 = 0.16 opacity = 84% transparent
Unfortunately, these settings are automatically overridden by Matlab when the figure is printed, saved, or exported:
% These commands result in an opaque (non-transparent) plot
print(gcf);
saveas(gcf, 'plot.png');


In some cases, the settings are lost even when the figure or axes is resized, or properties (e.g., Box) are changed. This is evident, for example, when the
hLine plot line is not drawn, only the area plot.The solution of one blog reader here [4] was to simply set the undocumented color transparency settings at the very end of the graphics set-up. However, as noted, this still does not answer the need to preserve the color settings when the figure is printed, saved, exported, or resized, or when axes properties change.
Another reader, Richard de Garis of Collins Capital [5], found an undocumented feature that seems to solve the problem for good. It turns out that the solution is simply to set the color to a “legal” (documented, non-transparent) color before setting the transparency values:
hArea = area(ydata);
hArea.FaceColor = 'b';  % or any other non-transparent color
drawnow; pause(0.05);  % this is important!
hArea.Face.ColorType = 'truecoloralpha';
hArea.Face.ColorData(4) = 40;  % 40/255 = 0.16 opacity = 84% transparent
Now the transparency settings are preserved, even when the figure is printed, saved, exported, resized etc.
The obvious explanation is that by manually updating the graphic object’s FaceColor, Matlab automatically updates the hidden property FaceColorMode from ‘auto’ to ‘manual’. This signals the graphics engine not to override the Face‘s color when such an update would otherwise be called for. The mechanism of having a <PropName>Mode property associated with the <PropName> was used in HG1 (Matlab’s previous Matlab graphics engine, up to R2014a). In HG2, more properties have added such associated *Mode properties. In most cases, these additional *Mode properties are hidden, as FaceColorMode is. I find this justified, because in most cases users shouldn’t update these properties, and should let Matlab handle the logic.
Unfortunately, this explanation is apparently false, as evident by the fact that setting FaceColorMode from ‘auto’ to ‘manual’ does not have the same desired effect. So for now I don’t know how to explain this phenomenon. At least we know it works, even if we don’t fully understand why [yet]. Oh well, I guess we can’t win ’em all…
Have you discovered and used some other interesting undocumented feature of HG2? If so, please share it in a comment below, or email me the details.
2 Comments To "Persisting transparent colors in HG2"
#1 Comment By Dani On October 29, 2015 @ 07:48
Still does not survive a legend call.
#2 Comment By Jacob On April 13, 2016 @ 11:58
I am finding this still does not persist with a resize.
Has anyone found any other stable fixes?