Undocumented Matlab
  • SERVICES
    • Consulting
    • Development
    • Training
    • Gallery
    • Testimonials
  • PRODUCTS
    • IQML: IQFeed-Matlab connector
    • IB-Matlab: InteractiveBrokers-Matlab connector
    • EODML: EODHistoricalData-Matlab connector
    • Webinars
  • BOOKS
    • Secrets of MATLAB-Java Programming
    • Accelerating MATLAB Performance
    • MATLAB Succinctly
  • ARTICLES
  • ABOUT
    • Policies
  • CONTACT

Transparent Matlab figure window

April 13, 2011 18 Comments

Every now and then, a user asks whether it is possible to make an entire Matlab window transparent (example). This could be used, for example, for window fade-in/fade-out effects. The short answer is that there is no supported way of doing this with pure documented Matlab, but it is trivially easy to achieve using just a bit of Java magic powder (surprise, surprise).

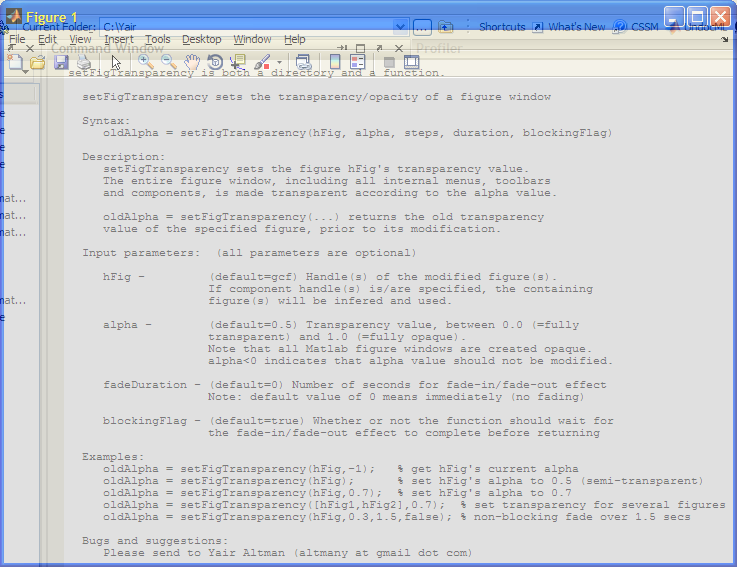
Matlab figure window transparency

Following an idea I got from Malcolm Lidierth’s MUtilities submission on the Matlab File Exchange, the solution for setting Matlab figure window transparency is quite simple: Get the figure’s underlying Java window reference handle, as in last week’s article. Then use Java’s setWindowOpacity method to set the window’s transparency value. Actually, setWindowOpacity sets the opacity level, rather than transparency, but they are obviously complementary and I personally find “transparency” to be more easily understandable.
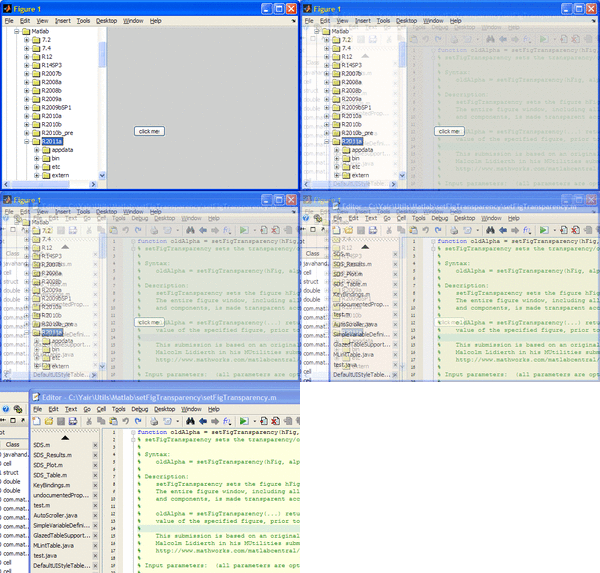
By default, windows are created with an opacity of 1.0 (= not transparent). They can be set to any floating-point value between 0.0-1.0, where an opacity of 0.0 means full transparency, and any value in between means partial transparency (i.e., translucency):

jFigPeer = get(handle(gcf),'JavaFrame');
jWindow = jFigPeer.fFigureClient.getWindow;
com.sun.awt.AWTUtilities.setWindowOpacity(jWindow,0.7)

jFigPeer = get(handle(gcf),'JavaFrame'); jWindow = jFigPeer.fFigureClient.getWindow; com.sun.awt.AWTUtilities.setWindowOpacity(jWindow,0.7)

Semi-transparent (translucent) Matlab figure (click to enlarge)

Similarly, you can set the entire Matlab Desktop’s transparency/opacity value:

jDesktop = com.mathworks.mde.desk.MLDesktop.getInstance.getMainFrame;
com.sun.awt.AWTUtilities.setWindowOpacity(jDesktop, 0.8);

jDesktop = com.mathworks.mde.desk.MLDesktop.getInstance.getMainFrame; com.sun.awt.AWTUtilities.setWindowOpacity(jDesktop, 0.8);

Note that the com.sun.awt.AWTUtilities class also enables other GUI effects that would make a Matlab GUI developer’s mouth to start drooling: shaped windows, per-pixel transparency values, mirroring/reflection, window shadows, gradients etc. Perhaps I’ll explore their adaptation for Matlab figures someday.

Fade-in / fade-out

Window fade-in/fade-out effects can easily be achieved using transparency: Simply invoke the setWindowOpacity method several times, with progressively higher or lower values. This is easily done in a simple blocking loop. For example, to fade-out a window:

for stepIdx = 1 : 5
   newAlpha = 1.0 - 0.2*stepIdx;
   com.sun.awt.AWTUtilities.setWindowOpacity(jWindow,newAlpha);
   jWindow.repaint;
   pause(0.2);  % seconds
end

for stepIdx = 1 : 5 newAlpha = 1.0 - 0.2*stepIdx; com.sun.awt.AWTUtilities.setWindowOpacity(jWindow,newAlpha); jWindow.repaint; pause(0.2); % seconds end

Gradual window fade-out

A more general example dynamically computes the opacity step size/duration and also enables non-blocking fade effects using an asynchronous timer:

% Compute the required opacity-setting steps
fadeDuration = 1.5;  % seconds
oldAlpha = com.sun.awt.AWTUtilities.getWindowOpacity(jWindow);
newAlpha = 0.0;
deltaAlpha = newAlpha - oldAlpha;
maxStepAlpha = 0.03;
steps = fix(abs(deltaAlpha) / maxStepAlpha) + 1;
stepAlpha = deltaAlpha / steps;
stepDuration = fadeDuration / (steps-1);
% If blocking, do the fade effect immediately
if blockingFlag || steps==1
   for stepIdx = 1 : steps
      newAlpha = oldAlpha + stepAlpha*stepIdx;
      com.sun.awt.AWTUtilities.setWindowOpacity(jWindow,newAlpha);
      jWindow.repaint;
      if stepIdx < steps,  pause(stepDuration);  end
   end
else
   % non-blocking: fade in/out asynchronously using a dedicated timer
   start(timer('ExecutionMode','fixedRate', 'Period',0.1, 'TasksToExecute',steps, ...
               'TimerFcn', {@timerFcn,jWindow,oldAlpha,stepAlpha}));
end
% Timer function for non-blocking fade-in/fade-out effect
function timerFcn(hTimer,eventData,jFrame,currentAlpha,stepAlpha)  %#ok<inusl> eventData
  stepIdx = hTimer.TasksExecuted;
  newAlpha = currentAlpha + stepAlpha*stepIdx;
  com.sun.awt.AWTUtilities.setWindowOpacity(jFrame,newAlpha);
  jFrame.repaint;
  if stepIdx == hTimer.TasksToExecute
      stop(hTimer);
      delete(hTimer);
  end
end  % timerFcn

% Compute the required opacity-setting steps fadeDuration = 1.5; % seconds oldAlpha = com.sun.awt.AWTUtilities.getWindowOpacity(jWindow); newAlpha = 0.0; deltaAlpha = newAlpha - oldAlpha; maxStepAlpha = 0.03; steps = fix(abs(deltaAlpha) / maxStepAlpha) + 1; stepAlpha = deltaAlpha / steps; stepDuration = fadeDuration / (steps-1); % If blocking, do the fade effect immediately if blockingFlag || steps==1 for stepIdx = 1 : steps newAlpha = oldAlpha + stepAlpha*stepIdx; com.sun.awt.AWTUtilities.setWindowOpacity(jWindow,newAlpha); jWindow.repaint; if stepIdx < steps, pause(stepDuration); end end else % non-blocking: fade in/out asynchronously using a dedicated timer start(timer('ExecutionMode','fixedRate', 'Period',0.1, 'TasksToExecute',steps, ... 'TimerFcn', {@timerFcn,jWindow,oldAlpha,stepAlpha})); end % Timer function for non-blocking fade-in/fade-out effect function timerFcn(hTimer,eventData,jFrame,currentAlpha,stepAlpha) %#ok<inusl> eventData stepIdx = hTimer.TasksExecuted; newAlpha = currentAlpha + stepAlpha*stepIdx; com.sun.awt.AWTUtilities.setWindowOpacity(jFrame,newAlpha); jFrame.repaint; if stepIdx == hTimer.TasksToExecute stop(hTimer); delete(hTimer); end end % timerFcn

Of course, you can also fade-in/out to intermediate values such as 0.3 or 0.8. If you fade-out completely (i.e., to a value of 0.0), it might be a good idea to actually close the figure window once it gets the totally-transparent value of 0.0.
I’ve prepared a Matlab utility that contains all these options, including optional blocking/non-blocking fade effects, in my setFigTransparency utility, which is available for download on the Matlab File Exchange. You may also wish to use Malcolm Lidierth’s MUtilities, which also has similar functionalities (plus some other goodies).

Limitations

Setting a figure window’s transparency requires using Java Run-time Engine (JRE) 1.6.0_10 (also called “Java 6 update 10”) or higher. This means that it’s supported on Matlab release 7.9 (R2009b) and higher by default, and on earlier releases using a JRE retrofit.
If you are using an earlier Matlab release, consider a retrofit of JRE 1.6.0_10 or any later version (e.g., the latest available version today is 1.6 update 24). The JRE can be downloaded from here, and you can configure Matlab to use it according to the instructions here. As noted, Matlab R2009b (7.9) and onward, at least on Microsoft Windows, pre-bundle a JRE version that does support transparency/opacity and so do not require a retrofit.
You can check your current Java version in Matlab as follows:

>> version -java
ans =
Java 1.6.0_17-b04 with Sun Microsystems Inc. Java HotSpot(TM) Client VM mixed mode

>> version -java ans = Java 1.6.0_17-b04 with Sun Microsystems Inc. Java HotSpot(TM) Client VM mixed mode

Unfortunately, Matlab plot axes cannot be made transparent. If you have any axes in your GUI, the axes area will simply appear as a shaded axes, whose intensity depends on the selected alpha (transparency) value; the contents beneath the window will not be merged in the axes area as it is in the non-axes areas.
Finally, note that com.sun.awt.AWTUtilities is itself an undocumented Java class. It is bundled with the standard Java release since 2008 (1.6.0_10), and yet is not part of the official release because its API has not yet settled. In fact, in the upcoming Java 7 release, which is expected in a few months, and which I expect to be available in Matlab sometime in 2012, the set of transparency/opacity methods have migrated to the fully-documented java.awt.Window class.

Blurred figure window

So here’s a riddle for you: using figure window transparency, can you guess how to make a Matlab figure appear blurred for disabled figures (see the screenshot there)? There are several possible ways to do this – can you find the simplest? The first one to post a comment with a correct answer gets a smiley… My answer will appear in next week’s article.

Upgraded website

Also, did you notice my new website design? It’s supposed to be much more readable (yes – also on Android…). It now also runs on a multi-server cloud, which means more stability and faster response times. Do you like the new design? hate it? I would love to hear your feedback via comment or email.

Related posts:

  1. Blurred Matlab figure window – Matlab figure windows can be blurred using a semi-transparent overlaid window - this article explains how...
  2. Enable/disable entire figure window – Disabling/enabling an entire figure window is impossible with pure Matlab, but is very simple using the underlying Java. This article explains how....
  3. Figure window customizations – Matlab figure windows can be customized in numerous manners using the underlying Java Frame reference. ...
  4. Minimize/maximize figure window – Matlab figure windows can easily be maximized, minimized and restored using a bit of undocumented magic powder...
  5. Detecting window focus events – Matlab does not have any documented method to detect window focus events (gain/loss). This article describes an undocumented way to detect such events....
  6. Frameless (undecorated) figure windows – Matlab figure windows can be made undecorated (borderless, title-less). ...
Desktop GUI Hidden property Java JavaFrame Malcolm Lidierth
Print Print
« Previous
Next »
18 Responses
  1. Brant A Jameson April 14, 2011 at 14:30 Reply

    Very Cool,
    I’ve had numerous applications for this, particularly when debugging/regression testing code. Thanks for the heads up!
    -Brant

  2. Jan Simon April 15, 2011 at 06:03 Reply

    Dear Yair,
    I definitely love the new layout! I’m using an old laptop with a 1024*768 screen for the internet access. Now much more of the screen is used for the text and I have to scroll less.
    Although this is really nice, I admit that I appreciate the contents of your pages even more. I needed a tree-view for a project in Matlab 2009a – no chance without your work! Thanks a lot, Jan

  3. Mory April 15, 2011 at 11:46 Reply

    Nice trick.

    Regarding your riddle, the code below seems to work. It could/should be improved with some callbacks to keep the overlay aligned.
    Another option is to use a solid underlay, and make the main figure semi-transparent. This requires a little bit more bookkeeping to make sure that the function can undo the “blur”, but allows the main figure to continue receiving UI input.

    function blurwindow(fnum)
    %BLURWINDOW  Blurs a given window.
    %    BLURWINDOW Blurs the current window
    %    BLURWINDOW(FNUM) blurs the given window.
    %
    %    BLURWINDOW clear REMOVES THE BLUR
     
    %Use a consistent, random figure number
    FNUMBLUR = 1636033446;
     
    %Input handling 
    if nargin < 1
        fnum = gcf;
    elseif ischar(fnum) && strcmpi(fnum,'clear')
        if ishandle(FNUMBLUR)
            close(FNUMBLUR);
        end
        return;
    end
     
    %Find the position of the figure to be blurred
    figPos = get(fnum,'position');
    figUnits = get(fnum,'units');
     
    %Setup the overlay figure
    figure(FNUMBLUR);
    set(FNUMBLUR,'units',figUnits);
    set(FNUMBLUR,'position',figPos);
    set(FNUMBLUR,'NumberTitle','off';
    drawnow;
     
    %Make the overlay semi-transparent
    jFigPeer = get(handle(FNUMBLUR),'JavaFrame');
    jWindow = jFigPeer.fFigureClient.getWindow;
    com.sun.awt.AWTUtilities.setWindowOpacity(jWindow,0.8)

    function blurwindow(fnum) %BLURWINDOW Blurs a given window. % BLURWINDOW Blurs the current window % BLURWINDOW(FNUM) blurs the given window. % % BLURWINDOW clear REMOVES THE BLUR %Use a consistent, random figure number FNUMBLUR = 1636033446; %Input handling if nargin < 1 fnum = gcf; elseif ischar(fnum) && strcmpi(fnum,'clear') if ishandle(FNUMBLUR) close(FNUMBLUR); end return; end %Find the position of the figure to be blurred figPos = get(fnum,'position'); figUnits = get(fnum,'units'); %Setup the overlay figure figure(FNUMBLUR); set(FNUMBLUR,'units',figUnits); set(FNUMBLUR,'position',figPos); set(FNUMBLUR,'NumberTitle','off'; drawnow; %Make the overlay semi-transparent jFigPeer = get(handle(FNUMBLUR),'JavaFrame'); jWindow = jFigPeer.fFigureClient.getWindow; com.sun.awt.AWTUtilities.setWindowOpacity(jWindow,0.8)

    • Yair Altman April 16, 2011 at 10:51 Reply

      @Mory – not bad for a first attempt, so you definitely deserve a 🙂

      The basic idea is to create an empty figure window in the exact size and position as the blurred window, overlay it on the blurred window, then set its opacity value to 0.8.

      The full answer is somewhat more complex, as you’ve hinted. For example, we also need to synchronize the figure/blurring color, menubar/toolbar, and title. We also need to handle docking, resizing and figure movement. Finally we need to connect the two figures so that whenever one is closed then so is the other.

      Anyone who can’t wait to next week’s article is welcome to look here.

  4. Controlling callback re-entrancy | Undocumented Matlab August 10, 2011 at 11:04 Reply

    […] months ago, I mentioned his work on another File Exchange contribution, MUtilities when I discussed transparent Matlab figure windows. Today, Malcolm discusses one of his lesser-known but extremely important isMultipleCall […]

  5. Alex April 20, 2012 at 10:01 Reply

    Hi

    I am not sure if this is possible but here we go. I am loading this image on a Matlab GUI and it’s quite an image so it takes some time to upload and I’ll like to add a waiting bar but I really don’t like the one provided by Matlab (Matlab it’s awesome but rates low in coolness and sleekness). I was reading your book and I would love to add what you presented on page 296-297 but I would like to present just the animation and not that gray background panel. I was trying to play with a method called paintAffordance but that doesn’t even exist in Java. Is there any way I could makes transparent the background of the BusyAffordance example transparent and just have the animation running and put it on top of the image I am trying to upload? Thanks.

    • Yair Altman April 21, 2012 at 10:27 Reply

      @Alex – unfortunately, Matlab does not (AFAIK) support transparent Java components. More on this in pages 358 (footnote) and 453 of my book.

    • Malcolm Lidierth April 22, 2012 at 08:10 Reply

      N.B. Swing/AWT transparency works fine with MATLAB on the Mac – but not Windows.
      MATLAB are deprecating ‘none’ as a background colorspec option in their containers. Maybe they are addressing this.

  6. julien June 23, 2012 at 07:45 Reply

    Hi Yair,
    I would like to draw lines and rectangles above both axes and uicontrols. It would be good to use matlab figure’s GlassPane (I found it in JavaFrame’s hierarchy) but I failed to draw anything in it.
    I also tried to add a transparent axes which overlays the entire figure but this way, I cannot draw above uicontrols.
    Do you have suggestions ? Thanks in advance for your help !

    • Yair Altman June 23, 2012 at 11:40 Reply

      @Julien – there may be a way to do this directly using the figure hierarchy, but I never tried it. Try using one of the other figure containers, not necessarily the glass pane. As an alternative, you can use the overlay transparent window trick mentioned in this article to draw whatever you wish on top of the uicontrols, as explained in the blurred figure window article.

      • Dirk Engel March 25, 2013 at 04:06

        Hi Yair,

        I had the same idea of using the GlassPane to overlay a JComponent with semi-transparent background to blur the ContentPane. This would be a nice solution to your riddle which goes without a helper figure, but it seems that neither the GlassPane nor other child components of the LayeredPane (except the ContentPane) get painted at all. Maybe the paint method of the RootPane (com.mathworks.mwswing.desk.DTRootPane) is responsible for this. Any ideas?

      • Yair Altman March 25, 2013 at 04:21

        @Dirk – welcome back!

        Unfortunately, all GUI controls added via Matlab, including uicontrols and javacomponents, use a heavyweight java.awt.Panel container, rather than a lightweight javax.swing.JPanel. Unfortunately, the heavyweight Panels, unlike lightweight JPanels, cannot be made transparent (at least on Windows). This means that even if the control or component is made transparent, this would still have no effect since their containing Panel is opaque. See an interesting discussion on this here.

        Note that while individual controls are opaque, the entire figure window can be made fully or partially transparent, as I have shown in the main article – the trick is not to update any specific control’s opacity but to work at the Java Frame level.

  7. ScreenCapture utility | Undocumented Matlab January 28, 2013 at 08:14 Reply

    […] The solution of the rbbox-anywhere feature relies on using a temporary transparent window that spans the entire desktop area, capturing user rbbox clicks anywhere within the desktop area. […]

  8. Martin Höcker June 12, 2013 at 08:50 Reply

    Looks great! For future reference, the code seem to need small modifications to work with Matlab 2013a. On my 32-bit Windows XP machine, I had to use:

    jFigPeer = get(handle(gcf),'JavaFrame');
    jWindow = jFigPeer.fHG1Client.getWindow;
    com.sun.awt.AWTUtilities.setWindowOpacity(jWindow,0.7)

    jFigPeer = get(handle(gcf),'JavaFrame'); jWindow = jFigPeer.fHG1Client.getWindow; com.sun.awt.AWTUtilities.setWindowOpacity(jWindow,0.7)

    • Yair Altman June 12, 2013 at 09:42 Reply

      @Martin – indeed so, and you will need to modify this again in HG2, as described here…

    • Malcolm Lidierth June 12, 2013 at 19:10 Reply

      Note that AWTUtilities simply calls the setOpacity method on the Window in Java 7. There are some conditions:
      The TRANSLUCENT translucency must be supported by the underlying system
      The window must not be in full-screen mode (see GraphicsDevice.setFullScreenWindow(Window))

      and also (new)

      The window must be undecorated (see Frame.setUndecorated(boolean) and Dialog.setUndecorated(boolean))

      MATLAB figures are decorated

  9. Razvan September 7, 2013 at 16:58 Reply

    Hi Yair,

    Is it possible to update setFigTransparency function in order to work in the latest MATLAB? It would be great if we could continue to use it after R2013b.

    • Yair Altman September 7, 2013 at 21:58 Reply

      @Razvan – unfortunately, unlike earlier Matlab releases, R2013b relies on Java 7. One of the changes that Oracle made in Java 7 was to prevent modification of an open window’s transparency, which was possible in Java 6. As consequence, setFigTransparency, blurFigure and any other Matlab utility that relies on this feature no longer work. AFAIK there is no fix for this.

Leave a Reply
HTML tags such as <b> or <i> are accepted.
Wrap code fragments inside <pre lang="matlab"> tags, like this:
<pre lang="matlab">
a = magic(3);
disp(sum(a))
</pre>
I reserve the right to edit/delete comments (read the site policies).
Not all comments will be answered. You can always email me (altmany at gmail) for private consulting.

Click here to cancel reply.

Useful links
  •  Email Yair Altman
  •  Subscribe to new posts (feed)
  •  Subscribe to new posts (reader)
  •  Subscribe to comments (feed)
 
Accelerating MATLAB Performance book
Recent Posts

Speeding-up builtin Matlab functions – part 3

Improving graphics interactivity

Interesting Matlab puzzle – analysis

Interesting Matlab puzzle

Undocumented plot marker types

Matlab toolstrip – part 9 (popup figures)

Matlab toolstrip – part 8 (galleries)

Matlab toolstrip – part 7 (selection controls)

Matlab toolstrip – part 6 (complex controls)

Matlab toolstrip – part 5 (icons)

Matlab toolstrip – part 4 (control customization)

Reverting axes controls in figure toolbar

Matlab toolstrip – part 3 (basic customization)

Matlab toolstrip – part 2 (ToolGroup App)

Matlab toolstrip – part 1

Categories
  • Desktop (45)
  • Figure window (59)
  • Guest bloggers (65)
  • GUI (165)
  • Handle graphics (84)
  • Hidden property (42)
  • Icons (15)
  • Java (174)
  • Listeners (22)
  • Memory (16)
  • Mex (13)
  • Presumed future risk (394)
    • High risk of breaking in future versions (100)
    • Low risk of breaking in future versions (160)
    • Medium risk of breaking in future versions (136)
  • Public presentation (6)
  • Semi-documented feature (10)
  • Semi-documented function (35)
  • Stock Matlab function (140)
  • Toolbox (10)
  • UI controls (52)
  • Uncategorized (13)
  • Undocumented feature (217)
  • Undocumented function (37)
Tags
ActiveX (6) AppDesigner (9) Callbacks (31) Compiler (10) Desktop (38) Donn Shull (10) Editor (8) Figure (19) FindJObj (27) GUI (141) GUIDE (8) Handle graphics (78) HG2 (34) Hidden property (51) HTML (26) Icons (9) Internal component (39) Java (178) JavaFrame (20) JIDE (19) JMI (8) Listener (17) Malcolm Lidierth (8) MCOS (11) Memory (13) Menubar (9) Mex (14) Optical illusion (11) Performance (78) Profiler (9) Pure Matlab (187) schema (7) schema.class (8) schema.prop (18) Semi-documented feature (6) Semi-documented function (33) Toolbar (14) Toolstrip (13) uicontrol (37) uifigure (8) UIInspect (12) uitools (20) Undocumented feature (187) Undocumented function (37) Undocumented property (20)
Recent Comments
  • Nicholas (3 days 22 hours ago): Hi Yair, Thanks for the reply. I am on Windows 10. I also forgot to mention that this all works wonderfully out of the editor. It only fails once compiled. So, yes, I have tried a...
  • Nicholas (3 days 22 hours ago): Hi Yair, Thanks for the reply. I am on Windows 10. I also forgot to mention that this all works wonderfully out of the editor. It only fails once compiled. So, yes, I have tried a...
  • Yair Altman (4 days 5 hours ago): Nicholas – yes, I used it in a compiled Windows app using R2022b (no update). You didn’t specify the Matlab code location that threw the error so I can’t help...
  • Nicholas (5 days 2 hours ago): Hi Yair, Have you attempted your displayWebPage utility (or the LightweightHelpPanel in general) within a compiled application? It appears to fail in apps derived from both R2022b...
  • João Neves (8 days 6 hours ago): I am on matlab 2021a, this still works: url = struct(struct(struct(struct(hF ig).Controller).PlatformHost). CEF).URL; but the html document is empty. Is there still a way to do...
  • Yair Altman (11 days 5 hours ago): Perhaps the class() function could assist you. Or maybe just wrap different access methods in a try-catch so that if one method fails you could access the data using another...
  • Jeroen Boschma (11 days 8 hours ago): Never mind, the new UI components have an HTML panel available. Works for me…
  • Alexandre (11 days 9 hours ago): Hi, Is there a way to test if data dictionnatry entry are signal, simulink parameters, variables … I need to access their value, but the access method depends on the data...
  • Nicholas (11 days 23 hours ago): In case anyone is looking for more info on the toolbar: I ran into some problems creating a toolbar with the lightweight panel. Previously, the Browser Panel had an addToolbar...
  • Jeroen Boschma (15 days 6 hours ago): I do not seem to get the scrollbars (horizontal…) working in Matlab 2020b. Snippets of init-code (all based on Yair’s snippets on this site) handles.text_explorer...
  • Yair Altman (43 days 8 hours ago): m_map is a mapping tool, not even created by MathWorks and not part of the basic Matlab system. I have no idea why you think that the customizations to the builtin bar function...
  • chengji chen (43 days 14 hours ago): Hi, I have tried the method, but it didn’t work. I plot figure by m_map toolbox, the xticklabel will add to the yticklabel at the left-down corner, so I want to move down...
  • Yair Altman (51 days 7 hours ago): @Alexander – this is correct. Matlab stopped including sqlite4java in R2021b (it was still included in 21a). You can download the open-source sqlite4java project from...
  • Alexander Eder (57 days 3 hours ago): Unfortunately Matlab stopped shipping sqlite4java starting with R2021(b?)
  • K (63 days 14 hours ago): Is there a way to programmatically manage which figure gets placed where? Let’s say I have 5 figures docked, and I split it into 2 x 1, I want to place 3 specific figures on the...
Contact us
Captcha image for Custom Contact Forms plugin. You must type the numbers shown in the image
Undocumented Matlab © 2009 - Yair Altman
This website and Octahedron Ltd. are not affiliated with The MathWorks Inc.; MATLAB® is a registered trademark of The MathWorks Inc.
Scroll to top