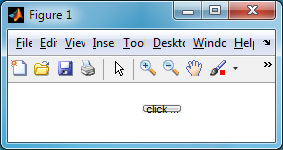
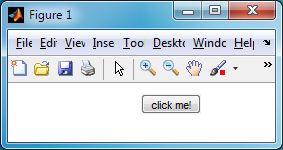
A well-known Matlab limitation is that component position vectors must be specified as either ‘normalized’ or some fixed-sized value, but not in combination. For example, we cannot place a button in the center of the screen (normalized x/y=0.5) with a fixed sized width/height. Either all position elements are normalized, or all are fixed. Most Matlab GUIs that I’ve seen keep the normalized units, with the result that buttons look bloated or shrunken when the figure is resized:
hButton = uicontrol('Units','norm', 'Position',[0.5,0.5,0.15,0.15], 'String','click me!'); |

A common way to address this latter limitation is to use a borderless containing uipanel at the requested normalized position, and place a fixed-sized component as a child of that panel:
bgColor = get(gcf,'Color'); hPanel = uipanel('Units','norm', 'Position',[0.5, 0.5, 0.45, 0.45], 'BorderType','none', 'BackgroundColor',bgColor); hButton = uicontrol('Parent',hPanel, 'Units','pixels', 'Position',[0,0,60,20], 'String','click me!'); |

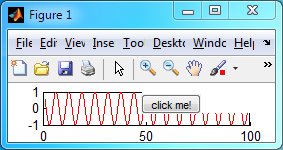
This works well in simple figures, where there is nothing beneath the panel/control. Resizing the figure will keep the button centered, while preserving its 60×20 size. But what happens if we have an axes beneath? In this case we encounter another Matlab limitation, that a top-most control always occludes (hides) an overlapped component. This is due to the fact that Matlab GUI uses heavyweight controls and containers, which do not allow transparency. For this reason, we cannot show a plot chart as the background of a table or listbox, for example. The result is that our panel will occlude the axes for a horrible-looking effect:
t = 1:.01:100; plot(t, cos(t), 'r'); bgColor = get(gcf,'Color'); hPanel = uipanel('Units','norm', 'Position',[0.5, 0.5, 0.45, 0.45], 'BorderType','none', 'BackgroundColor',bgColor); hButton = uicontrol('Parent',hPanel, 'Units','pixels', 'Position',[0,0,60,20], 'String','click me!'); |

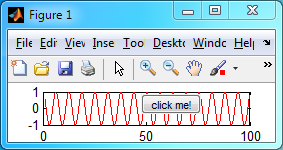
Which is where today’s undocumented feature comes in handy: simply set the uipanel’s BackgroundColor to ‘none’ and the panel will become transparent:
set(hPanel,'BackgroundColor','none') |

The reason that uipanel does not obey the occlusion limitation is simply because it is not really a control at all: Most Matlab GUI controls are simple wrappers for the standard Java Swing component (buttons for
JButton, listboxes for JListbox etc.). However, uipanel is not a wrapper for JPanel, as we might have expected, but rather implemented as as internal Matlab component that groups HG objects for onscreen display, and possibly paints the border (a uipanel‘s title is a simple text control once again) as a simple rectangle. This is the reason why Matlab’s borders look so different than JPanel‘s. This enabled Matlab to include the back-door of the ‘none’ BackgroundColor, which works for panels but not for any other GUI control.While BackgroundColor is a well-documented property, the ability to specify a colorspec of ‘none’ is not documented.
Note that setting the BackgroundColor to ‘none’ issues the following warning that you can ignore at your own risk:
Warning: "Setting the ColorSpec to 'none' for a uicontainer will not be allowed in a future release." |
To ignore (and stop issuing) such warnings, simply issue the following Matlab command:
warning off MATLAB:hg:ColorSpec_None warning('off', 'MATLAB:hg:ColorSpec_None'); % equivalent alternative |
p.s. – using a transparent panel in this manner is not necessary in certain cases (e.g., when the axes is added after the control, not before it as above). However, relying on such side-effects is not advised at all, for obvious reasons.
I look forward to the day when Matlab controls will be able to become truly transparent, and when the position and size units could be specified separately, so that use of such back-door kludges will not be necessary. After all, designing a GUI is supposed to resemble an art, not brain surgery…
Addendum for HG2 (R2014b onward)
In HG2, the panel’s BackgroundColor can no longer be set to 'none'. Luckily, in HG2 we have a direct reference to the underlying Java JPanel component, as I explained here. We can use this reference by setting it, as well as its direct parent and child components, to be non-opaque, as follows:
jPanel = hPanel.JavaFrame.getPrintableComponent; % hPanel is the Matlab handle to the uipanel jPanel.setOpaque(false) jPanel.getParent.setOpaque(false) jPanel.getComponent(0).setOpaque(false) jPanel.repaint |


I also look forward to the day when Matlab will provide 2D graphics that one can proudly show to somebody else, 3D graphics that that at least go in the same direction as what we have with the free ParaView, and indeed a GUI toolset that is both fast and functional. Every time a new release comes out I check if they made any progress. Nothing ever happens. Maybe a new ribbon design here and there. It looks like some time in the past they developed something that was marginally better than gnuplot and ever since they have been happy with that achievement. In the meantime we are well into the third millennium and every web browser can, with the help of javascript libraries, make plots that look like they were made today and not in the dark ages.
I am sorry about this nonconstructive rant, but I am frustrated that we have to make such efforts to circumvent the inadequate limitations of Matlab. At least with Yair’s help it is a bit easier.
Hi Yair,
maybe you could explain at this point how Mathworks achieves the positioning of the colorbar, which is of fixed width and relative position as well.
Thanks,
Ralf.
Another solution for the example given above is to set the uipanel location outside the figure. For example, to anchor the uicontrol to the center-top of the figure, use:
It can cause some odd (but manageable) stacking effects, but it works well for keeping a title or header line centered and top — and you don’t have to worry about it going away in a future version or about a transparent uipanel preventing user interaction with a plot/uicontrol.
@Patrick – nice idea, I like it.
It seems, that the ‘none’ option also works for the TextBoxHandle-BackgroundColor of a DataCursor.
The solution
does not work in MATLAB versions 2014b and 2015a.
Is there an another solution for the above-mentioned releases?
Thanks a lot,
Chris
@Chris – perhaps @Patrick’s solution above can help you in HG2 (R2014b+).
@ Yair Altman:
Thank you for the hint. I think that I can’t use Patrick’s solution for my gui problem.
I need a specific position of the panel (with some buttons) on the plot,
because if the mouse cursor of the user is on the panel area then the panel is shown.
I now have a solution for my specific problem:
I use for the axes and the buttons a parent panel and create the buttons after the creation of the axes.
If the mouse cursor is in a specific defined area, then the buttons’ visibility property is on, else off.
It seems to work for my problem.
Thanks a lot, nice website!
Best regards,
Chris
It seems in 15b things got really difficult. I would like to very simply place a rectangular outline on the figure telling the user to ‘look here’, regardless of what is under the box.
This would be easy if panels could be transparent – but they can’t anymore.
Additionally Patrick’s solution doesn’t work any more because panels ALWAYS clip their contents so that I cannot hide the panel outside the figure and then offset a rectangle to be in the figure. I have wanted panels to clip their controls for ages and now they overdo it. Careful what you wish for…
Any ideas how to simply overlay a rectangle on a figure regardless of what is underneath it?
Hi Yair
Have you had any thoughts how to add a transparent uipanel to the GUI in recent Matlab versions (post 15a)? I’m using GUILayout toolbox and so all my uicontrols and text labels are positioned on uipanels and I’d like to add a background image to the whole GUI.
Thanks to your other posts I can make various uicontrols and text labels transparent but the same trick doesn’t work with uipanels, so as soon as the uncontrol/label is positioned within a panel the transparency doesn’t work.
Any ideas?
@Martin – I am not aware of a solution to make uipanels transparent in 15b onward
I just added an addendum to the main post that explains how to set the uipanel’s background to transparent in HG2 (R2014b onward)
Hi Yair
Thanks for all your great workarounds.
I tried your last suggestion and indeed the uipanel becomes invisible. However, if the panel has any children then this does not appear to work. Is this something you have observed? I have basically been stuck on R2014a for years now because I can’t find a solution.
My application uses uipanels as GIS layers so they need to be transparent. Of course I could try recoding to just use axes, but the panels allows simpler resizing and moving of the layers and the code is large so would require a lot of work.
Hi Yair,
make transparent panel background is what I need for my application, but I have a problem:the panels I use have also a title, and the background of the title is not transparent. The effect is not so good, but I don’t know how can I do.
Any suggestions?
Is it possible apply a setOpaque method also to the title?
Thank
@Maurizio – instead of using the integrated Panel title, you can use a separate label control (
uicontrol('Style','text',...)or aJLabel). Alternatively, you can customize the uipanel’s title.* http://undocumentedmatlab.com/articles/customizing-matlab-uipanels
* http://undocumentedmatlab.com/articles/panel-level-uicontrols
Hi,
thank you so much for the inspiring work and comments!
My issue is: As soon as the panel gets an axes, the panel is no longer transparent:
It would be so helpful to have invisible Panels with axes! Especially because of the fact, that axes can not overlay “foreign” panels…
Does anybody have a clue?