Undocumented Matlab
  • SERVICES
    • Consulting
    • Development
    • Training
    • Gallery
    • Testimonials
  • PRODUCTS
    • IQML: IQFeed-Matlab connector
    • IB-Matlab: InteractiveBrokers-Matlab connector
    • EODML: EODHistoricalData-Matlab connector
    • Webinars
  • BOOKS
    • Secrets of MATLAB-Java Programming
    • Accelerating MATLAB Performance
    • MATLAB Succinctly
  • ARTICLES
  • ABOUT
    • Policies
  • CONTACT

Transparent legend

March 11, 2015 No Comments

I’ve been working lately on Matlab program for a client, which attempts to mimic the appearance and behavior of MetaTrader charts, which are extensively used by traders to visualize financial timeseries and analysis indicators.
Such charts are often heavily laden with information, and a legend can be handy to understand the meaning of the various plot lines. Unfortunately, in such heavily-laden charts the legend box typically overlaps the data. We can of course move the legend box around (programmatically or by interactive dragging). But in such cases it might be more useful to have the legend background become semi- or fully-transparent, such that the underlying plot lines would appear beneath the legend:
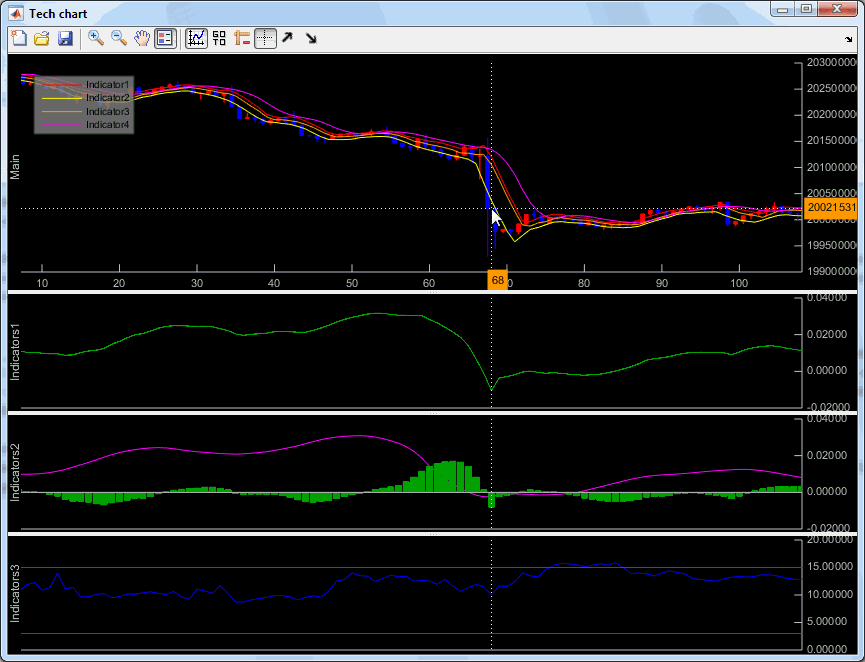
Matlab chart with a semi-transparent legend (click for details)


A few months ago I explained the undocumented feature of setting the transparency level of plot lines by simply specifying a fourth numeric (alpha) value to the Color property. Unfortunately, this technique does not work for all graphic objects. For example, setting a 4th (alpha) value to the MarkerFaceColor property results in an error. In the case of legends, setting a 4th (alpha) value to the legend handle’s Color property does not result in an error, but is simply ignored.
The solution in the case of legends is similar in concept to that of the MarkerFaceColor property, which I explained here. The basic idea is to use one of the legend’s hidden properties (in this case, BoxFace) in order to access the low-level color properties (which I have already explained in previous posts):

>> hLegend = legend(...);
>> hLegend.Color = [0.5, 0.5, 0.5, 0.8];  % should be 20%-transparent gray, but in fact opaque gray
>> hLegend.BoxFace.get
             AmbientStrength: 0.3
             BackFaceCulling: 'none'
                ColorBinding: 'object'
                   ColorData: [4x1 uint8]
                   ColorType: 'truecolor'
             DiffuseStrength: 0.6
            HandleVisibility: 'on'
                     HitTest: 'off'
                       Layer: 'back'
               NormalBinding: 'none'
                  NormalData: []
                      Parent: [1x1 Group]
               PickableParts: 'visible'
    SpecularColorReflectance: 1
            SpecularExponent: 10
            SpecularStrength: 0.9
                   StripData: []
                     Texture: []
            TwoSidedLighting: 'off'
                  VertexData: [3x4 single]
               VertexIndices: []
                     Visible: 'on'
>> hLegend.BoxFace.ColorData  % 4x1 uint8
ans =
  128
  128
  128
  255   % this is the alpha value

>> hLegend = legend(...); >> hLegend.Color = [0.5, 0.5, 0.5, 0.8]; % should be 20%-transparent gray, but in fact opaque gray >> hLegend.BoxFace.get AmbientStrength: 0.3 BackFaceCulling: 'none' ColorBinding: 'object' ColorData: [4x1 uint8] ColorType: 'truecolor' DiffuseStrength: 0.6 HandleVisibility: 'on' HitTest: 'off' Layer: 'back' NormalBinding: 'none' NormalData: [] Parent: [1x1 Group] PickableParts: 'visible' SpecularColorReflectance: 1 SpecularExponent: 10 SpecularStrength: 0.9 StripData: [] Texture: [] TwoSidedLighting: 'off' VertexData: [3x4 single] VertexIndices: [] Visible: 'on' >> hLegend.BoxFace.ColorData % 4x1 uint8 ans = 128 128 128 255 % this is the alpha value

As can be seen from this code snippet, the RGB ingredients (but not the alpha value) of Color have passed through to the BoxFace‘s ColorData. The problem stems from BoxFace‘s default ColorType value of 'truecolor'. Once we set it to 'truecoloralpha', we can set ColorData‘s alpha value to a value between uint8(0) and uint8(255):

set(hLegend.BoxFace, 'ColorType','truecoloralpha', 'ColorData',uint8(255*[.5;.5;.5;.8]));  % [.5,.5,.5] is light gray; 0.8 means 20% transparent

set(hLegend.BoxFace, 'ColorType','truecoloralpha', 'ColorData',uint8(255*[.5;.5;.5;.8])); % [.5,.5,.5] is light gray; 0.8 means 20% transparent

Opaque (default) legend 20% transparent legend 50% transparent legend
0% transparent (default) 20% transparent 50% transparent
ColorData = [128;128;128;255] [128;128;128;204] [128;128;128;128]

Note 1: ColorData only accepts a column-vector of 4 uint8 values between 0-255. Attempting to set the value to a row vector or non-uint8 values will result in an error.
Note 2: once we update the BoxFace color, the legend’s standard Color property loses its connection to the underlying BoxFace.ColorData, so updating hLegend.Color will no longer have any effect.
BoxFace.ColorType also accepts 'colormapped' and 'texturemapped' values; the BoxFace.ColorBinding accepts values of 'none', 'discrete' and 'interpolated', in addition to the default value of 'object'. Readers are encouraged to play with these values for colorful effects (for example, gradient background colors).
Finally, note that this entire discussion uses Matlab’s new graphics engine (HG2), on R2014b or newer. For those interested in semi-transparent legends in R2014a or older (HG1), this can be done as follows:

% Prepare a fully-transparent legend (works in both HG1, HG2)
hLegend = legend(...);
set(hLegend, 'Color','none');  % =fully transparent
% This fails in HG2 since patch cannot be a child of a legend,
% but it works well in HG1 where legends are simple axes:
patch('Parent',hLegend, 'xdata',[0,0,1,1,0], 'ydata',[0,1,1,0,0], 'HitTest','off', 'FaceColor','y', 'FaceAlpha',0.2);  % 0.2 = 80% transparent

% Prepare a fully-transparent legend (works in both HG1, HG2) hLegend = legend(...); set(hLegend, 'Color','none'); % =fully transparent % This fails in HG2 since patch cannot be a child of a legend, % but it works well in HG1 where legends are simple axes: patch('Parent',hLegend, 'xdata',[0,0,1,1,0], 'ydata',[0,1,1,0,0], 'HitTest','off', 'FaceColor','y', 'FaceAlpha',0.2); % 0.2 = 80% transparent

Note that making legends fully-transparent is easy in either HG1 or HG2: simply set the legend’s Color property to 'none'. In HG2 this causes a quirk that the legend background becomes non-draggable (you can only drag the legend box-frame – transparent HG2 backgrounds to not trap mouse evens in the same way that opaque backgrounds do (i.e., when the HG2 legend has Color='w', the background is draggable just like the box-frame). In HG1, this does not happen, so a transparent background is just as draggable as an opaque one.
In any case, as noted above, while making the legend fully-transparent is simple, making it semi-transparent is more problematic. Which is where this post could help.
If you’ve found any other interesting use of these undocumented/hidden legend properties, please share it in a comment below. If you’d like me to develop a custom GUI (such as the charting program above or any other GUI) for you, please contact me by email or using my contact form.

Related posts:

  1. Multi-column (grid) legend – This article explains how to use undocumented axes listeners for implementing multi-column plot legends...
  2. Plot legend title – Titles to plot legends are easy to achieve in HG1 (R2014a or earlier), but much more difficult in HG2 (R2014b or newer). ...
  3. Transparent uipanels – Matlab uipanels can be made transparent, for very useful effects. ...
  4. Persisting transparent colors in HG2 – We can set semi- and fully-transparent colors in HG2 for multiple graphic objects, but making these settings stick is non-trivial. ...
  5. Plot legend customization – Matlab plot legends and their internal components can be customized using a variety of undocumented properties that are easily accessible. ...
  6. Legend '-DynamicLegend' semi-documented feature – The built-in Matlab legend function has a very useful semi-documented feature for automatic dynamic update, which is explained here....
Handle graphics HG2 Hidden property Pure Matlab Undocumented feature
Print Print
« Previous
Next »
Leave a Reply
HTML tags such as <b> or <i> are accepted.
Wrap code fragments inside <pre lang="matlab"> tags, like this:
<pre lang="matlab">
a = magic(3);
disp(sum(a))
</pre>
I reserve the right to edit/delete comments (read the site policies).
Not all comments will be answered. You can always email me (altmany at gmail) for private consulting.

Click here to cancel reply.

Useful links
  •  Email Yair Altman
  •  Subscribe to new posts (feed)
  •  Subscribe to new posts (reader)
  •  Subscribe to comments (feed)
 
Accelerating MATLAB Performance book
Recent Posts

Speeding-up builtin Matlab functions – part 3

Improving graphics interactivity

Interesting Matlab puzzle – analysis

Interesting Matlab puzzle

Undocumented plot marker types

Matlab toolstrip – part 9 (popup figures)

Matlab toolstrip – part 8 (galleries)

Matlab toolstrip – part 7 (selection controls)

Matlab toolstrip – part 6 (complex controls)

Matlab toolstrip – part 5 (icons)

Matlab toolstrip – part 4 (control customization)

Reverting axes controls in figure toolbar

Matlab toolstrip – part 3 (basic customization)

Matlab toolstrip – part 2 (ToolGroup App)

Matlab toolstrip – part 1

Categories
  • Desktop (45)
  • Figure window (59)
  • Guest bloggers (65)
  • GUI (165)
  • Handle graphics (84)
  • Hidden property (42)
  • Icons (15)
  • Java (174)
  • Listeners (22)
  • Memory (16)
  • Mex (13)
  • Presumed future risk (394)
    • High risk of breaking in future versions (100)
    • Low risk of breaking in future versions (160)
    • Medium risk of breaking in future versions (136)
  • Public presentation (6)
  • Semi-documented feature (10)
  • Semi-documented function (35)
  • Stock Matlab function (140)
  • Toolbox (10)
  • UI controls (52)
  • Uncategorized (13)
  • Undocumented feature (217)
  • Undocumented function (37)
Tags
ActiveX (6) AppDesigner (9) Callbacks (31) Compiler (10) Desktop (38) Donn Shull (10) Editor (8) Figure (19) FindJObj (27) GUI (141) GUIDE (8) Handle graphics (78) HG2 (34) Hidden property (51) HTML (26) Icons (9) Internal component (39) Java (178) JavaFrame (20) JIDE (19) JMI (8) Listener (17) Malcolm Lidierth (8) MCOS (11) Memory (13) Menubar (9) Mex (14) Optical illusion (11) Performance (78) Profiler (9) Pure Matlab (187) schema (7) schema.class (8) schema.prop (18) Semi-documented feature (6) Semi-documented function (33) Toolbar (14) Toolstrip (13) uicontrol (37) uifigure (8) UIInspect (12) uitools (20) Undocumented feature (187) Undocumented function (37) Undocumented property (20)
Recent Comments
  • Nicholas (7 days 0 hours ago): Hi Yair, Thanks for the reply. I am on Windows 10. I also forgot to mention that this all works wonderfully out of the editor. It only fails once compiled. So, yes, I have tried a...
  • Nicholas (7 days 0 hours ago): Hi Yair, Thanks for the reply. I am on Windows 10. I also forgot to mention that this all works wonderfully out of the editor. It only fails once compiled. So, yes, I have tried a...
  • Yair Altman (7 days 7 hours ago): Nicholas – yes, I used it in a compiled Windows app using R2022b (no update). You didn’t specify the Matlab code location that threw the error so I can’t help...
  • Nicholas (8 days 4 hours ago): Hi Yair, Have you attempted your displayWebPage utility (or the LightweightHelpPanel in general) within a compiled application? It appears to fail in apps derived from both R2022b...
  • João Neves (11 days 8 hours ago): I am on matlab 2021a, this still works: url = struct(struct(struct(struct(hF ig).Controller).PlatformHost). CEF).URL; but the html document is empty. Is there still a way to do...
  • Yair Altman (14 days 7 hours ago): Perhaps the class() function could assist you. Or maybe just wrap different access methods in a try-catch so that if one method fails you could access the data using another...
  • Jeroen Boschma (14 days 10 hours ago): Never mind, the new UI components have an HTML panel available. Works for me…
  • Alexandre (14 days 11 hours ago): Hi, Is there a way to test if data dictionnatry entry are signal, simulink parameters, variables … I need to access their value, but the access method depends on the data...
  • Nicholas (15 days 1 hour ago): In case anyone is looking for more info on the toolbar: I ran into some problems creating a toolbar with the lightweight panel. Previously, the Browser Panel had an addToolbar...
  • Jeroen Boschma (18 days 8 hours ago): I do not seem to get the scrollbars (horizontal…) working in Matlab 2020b. Snippets of init-code (all based on Yair’s snippets on this site) handles.text_explorer...
  • Yair Altman (46 days 10 hours ago): m_map is a mapping tool, not even created by MathWorks and not part of the basic Matlab system. I have no idea why you think that the customizations to the builtin bar function...
  • chengji chen (46 days 16 hours ago): Hi, I have tried the method, but it didn’t work. I plot figure by m_map toolbox, the xticklabel will add to the yticklabel at the left-down corner, so I want to move down...
  • Yair Altman (54 days 10 hours ago): @Alexander – this is correct. Matlab stopped including sqlite4java in R2021b (it was still included in 21a). You can download the open-source sqlite4java project from...
  • Alexander Eder (60 days 5 hours ago): Unfortunately Matlab stopped shipping sqlite4java starting with R2021(b?)
  • K (66 days 16 hours ago): Is there a way to programmatically manage which figure gets placed where? Let’s say I have 5 figures docked, and I split it into 2 x 1, I want to place 3 specific figures on the...
Contact us
Captcha image for Custom Contact Forms plugin. You must type the numbers shown in the image
Undocumented Matlab © 2009 - Yair Altman
This website and Octahedron Ltd. are not affiliated with The MathWorks Inc.; MATLAB® is a registered trademark of The MathWorks Inc.
Scroll to top