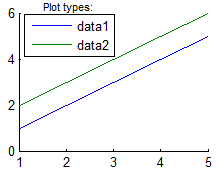
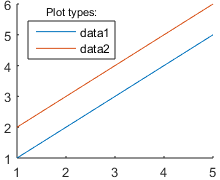
This blog post was supposed to be a piece of cake: The problem description was that we wish to display a text title next to the legend box in plot axes. Sounds simple enough. After all, in HG1 (R2014a and earlier), a legend was a simple wrapper around a standard Matlab axes. Therefore, we can simply access the legend axes’s title handle, and modify its properties. This works very well in HG1:
hold all;
hLine1 = plot(1:5);
hLine2 = plot(2:6);
hLegend = legend([hLine1,hLine2], 'Location','NorthWest');
hTitle = get(hLegend,'title');
set(hTitle, 'String','Plot types:', 'VerticalAlignment','middle', 'FontSize',8);

HG2
How hard then could a corresponding solution be in HG2 (R2014b+), right?
Well, it turns out that hard enough (at least for me)…
In this blog I’ve presented ~300 posts so far that discuss solutions to problems. Readers of this blog always hear the success stories, and might mistakenly think that every problem has a similarly simple solution that can be hacked away in a few lines of nifty code.
Well, the truth must be told that for each investigation that yields such a success story, there is at least one other investigation in which I failed to find a solution, no matter how hard I tried or countless hours spent digging (this is not to say that the success stories are easy – distilling a solution to a few lines of code often takes hours of research). In any case, maybe some of these problems for which I have not found a solution do have one that I have simply not discovered, and maybe they don’t – in most likelihood I will never know.
This is yet another example of such a spectacular failure on my part. Try as I may in HG2, I could find no internal handle anywhere to the legend’s axes or title handle. As far as I could tell, HG2’s legend is a standalone object of class matlab.graphics.illustration.Legend that derives from exactly the same superclasses as axes:
>> sort(superclasses('matlab.graphics.axis.Axes'))
ans =
    'JavaVisible'
    'dynamicprops'
    'handle'
    'matlab.graphics.Graphics'
    'matlab.graphics.GraphicsDisplay'
    'matlab.graphics.internal.GraphicsJavaVisible'
    'matlab.mixin.CustomDisplay'
    'matlab.mixin.Heterogeneous'
    'matlab.mixin.SetGet'
|
>> sort(superclasses('matlab.graphics.illustration.Legend'))
ans =
    'JavaVisible'
    'dynamicprops'
    'handle'
    'matlab.graphics.Graphics'
    'matlab.graphics.GraphicsDisplay'
    'matlab.graphics.internal.GraphicsJavaVisible'
    'matlab.mixin.CustomDisplay'
    'matlab.mixin.Heterogeneous'
    'matlab.mixin.SetGet'
|
This make sense, since they share many properties/features. But it also means that legends are apparently not axes but rather unrelated siblings. As such, if MathWorks chose to remove the Title property from the legend object, we will never find it.
So what can we do in HG2?
Well, we can always resort to the poor-man’s solution of an optical illusion [1]: displaying a an invisible axes object having the same Position as the legend box, with an axes title. We attach property listeners on the legend’s Units, Position and Visible properties, linking them to the corresponding axes properties, so that the title will change if and when the legend’s properties change (for example, by dragging the legend to a different location, or by resizing the figure). We also add an event listener to destroy the axes (and its title) when the legend is destroyed:
% Create the legend
hLegend = legend(...);  % as before
% Create an invisible axes at the same position as the legend
hLegendAxes = axes('Parent',hLegend.Parent, 'Units',hLegend.Units, 'Position',hLegend.Position, ...
                   'XTick',[] ,'YTick',[], 'Color','none', 'YColor','none', 'XColor','none', 'HandleVisibility','off', 'HitTest','off');
% Add the axes title (will appear directly above the legend box)
hTitle = title(hLegendAxes, 'Plot types:', 'FontWeight','normal', 'FontSize',8);  % Default is bold-11, which is too large
% Link between some property values of the legend and the new axes
hLinks = linkprop([hLegend,hLegendAxes], {'Units', 'Position', 'Visible'});
% persist hLinks, otherwise they will stop working when they go out of scope
setappdata(hLegendAxes, 'listeners', hLinks);
% Add destruction event listener (no need to persist here - this is done by addlistener)
addlistener(hLegend, 'ObjectBeingDestroyed', @(h,e)delete(hLegendAxes));

Yes, this is indeed a bit of an unfortunate regression from HG1, but I currently see no other way to solve this. We can’t win ’em all… If you know a better solution, I’m all ears. Please shoot me an email, or leave a comment below.
Update: As suggested below by Martin, here is a more elegant solution, which attaches a text object as a direct child of the legend’s hidden property DecorationContainer (we cannot add it as a child of the legend since this is prevented and results in an error):
hLegend = legend(...);
hlt = text(...
    'Parent', hLegend.DecorationContainer, ...
    'String', 'Title', ...
    'HorizontalAlignment', 'center', ...
    'VerticalAlignment', 'bottom', ...
    'Position', [0.5, 1.05, 0], ...
    'Units', 'normalized');
The title appears to stay attached to the legend and the Parent property of the text object even reports the legend object as its parent:
hLegend.Location = 'southwest';  % Test the title's attachment
hlt.Parent % Returns hLegend
– thanks Martin!
Happy Passover/Easter everybody!
Addendum: As pointed out by Eike in a comment below [2], Matlab release R2016a has restored the Title property. This property holds a handle to a Text object, for which we can set properties such as String, Color, FontSize etc.
11 Comments To "Plot legend title"
#1 Comment By Fred On April 1, 2015 @ 15:34
The workaround I use is to plot the first point of my first line with ‘w.’, then include it as the first handle in my call to legend, with its text as the desired legend title. In this example the handles for the legend are left implicit.
figure
hold on;
plot(r(1),'w.');
plot(r);
legend('Traces','First','Second')
Cheers,
#2 Comment By Martin On April 1, 2015 @ 15:44
I haven’t really tested for any undesired side effects, but I have the feeling that this qualifies as a more elegant solution:
hLegend = legend(...)
hlt = text(...
    'Parent', hLegend.DecorationContainer, ...
    'String', 'Title', ...
    'HorizontalAlignment', 'center', ...
    'VerticalAlignment', 'bottom', ...
    'Position', [0.5, 1.05, 0], ...
    'Units', 'normalized');
The title appears to stay attached to the legend and the Parent property of the text object even reports the legend object as its parent:
I tested this with R2015a. The DecorationContainer was simply the first in a rather long list of properties that sounded like it could be useful.
#3 Comment By Yair Altman On April 1, 2015 @ 16:42
@Martin – thanks! this is indeed more elegant. I tried setting a text object’s Parent directly to the legend and received an error (“Text cannot be a child of Legend”); I then tried to set the DecorationContainer’s title property and got another error (since it’s not an axes and has no such property); but I didn’t think to simply try what you did, which is a variant of my failed attempts…
I guess it shows us that we should never give up hope, maybe just take a step back and rethink about the problem.
Thanks again!
#4 Comment By Martin On April 3, 2015 @ 08:36
@Yair – thanks for improving my comment and fixing the minor error I included! I see you read those comments very carefully. 🙂
R2015a made it easier to to explore HG2 (and the many undocumented properties/methods of the related classes) by adding the new (and hidden) Type property to the meta.property class and the InputTypes and OutputTypes properties to the the meta.method class. For example:
Knowing the type of a property can be especially helpful to find out what can be assigned to it. Sometimes one even gets a list of valid values (e.g. the CameraMode property of the above Axes class).
#5 Comment By Yair Altman On April 8, 2015 @ 13:15
@Martin – thanks, interesting. I have a hunch that this is related to the undocumented mechanism of [9] using the so-called “@-filter”:
properties
    Name@char = 'abc'
    Width@double = 10
end
Unfortunately, I tried this @-filter on method input/output args and it croacks. So either it’s not implemented yet, or MathWorks may have changed the syntax, or maybe I’m just misreading the situation…
#6 Comment By Martin On April 8, 2015 @ 23:29
@Yair – Yes, I’d say this is related. Obviously, there is internal support for data types for both properties and function/method arguments. But only the former got the (undocumented) @-syntax in the MATLAB language, as described by your linked post. The latter seems to be reserved to built-in functions and methods of built-in classes, that are implemented in C++ and are thus not restricted by what is exposed to the MATLAB language. (I also tried and failed to find a syntax that would work for arguments.)
I wonder why MathWorks decided to expose only “half” of this data type feature to MATLAB programmers. And I wonder why they added “full” support for querying this information directly from MATLAB in R2015a. (Not that I’m complaining, it provides interesting insights.)
Finally, I wonder what those data types really are. (I think we had something similar in the UDD class system.) They are not real classes, as can be seen in many instances in HG2. But classes can be used as data types. Will data types be fully exposed to the MATLAB language? Will we be able to create and use custom data types in the future?
#7 Comment By Robert Cumming On April 2, 2015 @ 08:22
@Yair,
Interesting as always – Adding a legend title is one of the functions in my [10] and I uploaded this particular code as a [11] which covers HG1 & HG2.
@Martin – Nice solution! 🙂
#8 Comment By Tom Heine On March 9, 2016 @ 00:01
I have found one downside to the Martin’s approach. For some reason, when I save the figure as a .fig, the legend title isn’t saved.
#9 Comment By Eike Blechschmidt On June 6, 2017 @ 16:53
In Matlab 2016a it works if you use:
#10 Comment By EBH On June 23, 2017 @ 16:51
You might want to see another issue with the new legend title that I solved here
#11 Comment By Yair Altman On June 25, 2017 @ 00:54
???