Undocumented Matlab
  • SERVICES
    • Consulting
    • Development
    • Training
    • Gallery
    • Testimonials
  • PRODUCTS
    • IQML: IQFeed-Matlab connector
    • IB-Matlab: InteractiveBrokers-Matlab connector
    • EODML: EODHistoricalData-Matlab connector
    • Webinars
  • BOOKS
    • Secrets of MATLAB-Java Programming
    • Accelerating MATLAB Performance
    • MATLAB Succinctly
  • ARTICLES
  • ABOUT
    • Policies
  • CONTACT

Bug and workaround in timeseries plot

September 7, 2011 4 Comments

I was about to write on something completely different today, when I discovered the following internal Matlab bug (and workaround) that I thought could be useful to some readers, so I changed my plans and the original article will see light next week (or the next, or whenever…).

The bug

Try the following code snippet:

today = fix(now);
ts = timeseries(rand(1,201), datestr(today-200:today));
figure;
hPanel = uipanel('units','norm','pos',[.2,.2,.5,.5]);
hAxes = axes('Parent',hPanel, 'units','norm');
plot(ts, 'Parent',hAxes);

today = fix(now); ts = timeseries(rand(1,201), datestr(today-200:today)); figure; hPanel = uipanel('units','norm','pos',[.2,.2,.5,.5]); hAxes = axes('Parent',hPanel, 'units','norm'); plot(ts, 'Parent',hAxes);

As you can see, the plot’s x-tick labels are all bunched together:
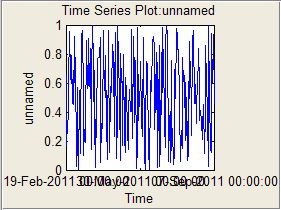
Timeseries plot bug (note x tick labels)

The workaround

I debugged the problem and traced it to line #317 of …\R2011b\toolbox\matlab\timeseries\@timeseries\plot.m (in the R2011b installation):

axpos = hgconvertunits(f,get(ax,'Position'),get(ax,'Units'),'normalized',f);

axpos = hgconvertunits(f,get(ax,'Position'),get(ax,'Units'),'normalized',f);

This line uses hgconvertunits to get the figure-based normalized units of the axes. hgconvertunits is an internal semi-documented helper function that convert a Handle-Graphics position vector in one set of units into another position vector in other units based on some other reference HG object. For example, it can tell me what the position of an internal control is in normalized figure units, even if the control is deeply nested within multiple panels. Which is exactly what it tries to do in this case.
Unfortunately, hgconvertunits apparently has a bug that causes it to return the parent-based normalized position values rather than the figure-based ones in this particular case. This causes the function to think that the axes is much bigger than it really is, and therefore it uses more x-tick labels than it should.
This hgconvertunits bug may very possibly affect numerous other Matlab functions that use this built-in function. The correct fix is to fix the hgconvertunits function. However, since this is an non-modifiable internal function, I found the following workaround for the timeseries plot only, by replacing the above line with the following:

axpos = hgconvertunits(f,getpixelposition(ax,f),'pixel','normalized',f);

axpos = hgconvertunits(f,getpixelposition(ax,f),'pixel','normalized',f);

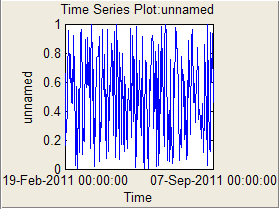
Timeseries plot fix (note x tick labels)

Now the x-tick labels appear nicely, including during resize and zooming.
This problem occurs on R2011b. I was able to recreate the same problem and use the same fix back to R2010b. I do not know how far earlier the bug goes…
I reported the problem today (1-FEM0L7 for anyone interested). If I learn of a patch for hgconvertunits I will post an addendum on this page.

Related posts:

  1. Matlab compiler bug and workaround – Both the Matlab compiler and the publish function have errors when parsing block-comments in Matlab m-code. ...
  2. Plot performance – Undocumented inner plot mechanisms can significantly improve plotting performance ...
  3. Bar plot customizations – Matlab bar charts can be customized in various nifty ways. ...
  4. Plot legend title – Titles to plot legends are easy to achieve in HG1 (R2014a or earlier), but much more difficult in HG2 (R2014b or newer). ...
  5. Plot LimInclude properties – The plot objects' XLimInclude, YLimInclude, ZLimInclude, ALimInclude and CLimInclude properties are an important feature, that has both functional and performance implications....
  6. Undocumented scatter plot jitter – Matlab's scatter plot can automatically jitter data to enable better visualization of distribution density. ...
Handle graphics Internal component Pure Matlab Semi-documented function
Print Print
« Previous
Next »
4 Responses
  1. jeff December 22, 2011 at 19:48 Reply

    Yair,

    Ordered your book on Tuesday. Looking forward to reading it. Any word on a fix for the timeseries plot function?

    • Yair Altman December 23, 2011 at 04:14 Reply

      @Jeff – what do you mean by “any word on a fix?” – my entire post was about the fix… I don’t follow what you mean

  2. Pinning annotations to graphs | Undocumented Matlab December 12, 2012 at 11:02 Reply

    […] use the undocumented hgconvertunits function to convert from pixel units into normalized figure units […]

  3. asmf February 23, 2018 at 13:24 Reply

    In R2016b I replaced call to hgconvertunits with getpixelposition in dateTickPicker.

Leave a Reply
HTML tags such as <b> or <i> are accepted.
Wrap code fragments inside <pre lang="matlab"> tags, like this:
<pre lang="matlab">
a = magic(3);
disp(sum(a))
</pre>
I reserve the right to edit/delete comments (read the site policies).
Not all comments will be answered. You can always email me (altmany at gmail) for private consulting.

Click here to cancel reply.

Useful links
  •  Email Yair Altman
  •  Subscribe to new posts (feed)
  •  Subscribe to new posts (reader)
  •  Subscribe to comments (feed)
 
Accelerating MATLAB Performance book
Recent Posts

Speeding-up builtin Matlab functions – part 3

Improving graphics interactivity

Interesting Matlab puzzle – analysis

Interesting Matlab puzzle

Undocumented plot marker types

Matlab toolstrip – part 9 (popup figures)

Matlab toolstrip – part 8 (galleries)

Matlab toolstrip – part 7 (selection controls)

Matlab toolstrip – part 6 (complex controls)

Matlab toolstrip – part 5 (icons)

Matlab toolstrip – part 4 (control customization)

Reverting axes controls in figure toolbar

Matlab toolstrip – part 3 (basic customization)

Matlab toolstrip – part 2 (ToolGroup App)

Matlab toolstrip – part 1

Categories
  • Desktop (45)
  • Figure window (59)
  • Guest bloggers (65)
  • GUI (165)
  • Handle graphics (84)
  • Hidden property (42)
  • Icons (15)
  • Java (174)
  • Listeners (22)
  • Memory (16)
  • Mex (13)
  • Presumed future risk (394)
    • High risk of breaking in future versions (100)
    • Low risk of breaking in future versions (160)
    • Medium risk of breaking in future versions (136)
  • Public presentation (6)
  • Semi-documented feature (10)
  • Semi-documented function (35)
  • Stock Matlab function (140)
  • Toolbox (10)
  • UI controls (52)
  • Uncategorized (13)
  • Undocumented feature (217)
  • Undocumented function (37)
Tags
AppDesigner (9) Callbacks (31) Compiler (10) Desktop (38) Donn Shull (10) Editor (8) Figure (19) FindJObj (27) GUI (141) GUIDE (8) Handle graphics (78) HG2 (34) Hidden property (51) HTML (26) Icons (9) Internal component (39) Java (178) JavaFrame (20) JIDE (19) JMI (8) Listener (17) Malcolm Lidierth (8) MCOS (11) Memory (13) Menubar (9) Mex (14) Optical illusion (11) Performance (78) Profiler (9) Pure Matlab (187) schema (7) schema.class (8) schema.prop (18) Semi-documented feature (6) Semi-documented function (33) Toolbar (14) Toolstrip (13) uicontrol (37) uifigure (8) UIInspect (12) uitable (6) uitools (20) Undocumented feature (187) Undocumented function (37) Undocumented property (20)
Recent Comments
Contact us
Captcha image for Custom Contact Forms plugin. You must type the numbers shown in the image
Undocumented Matlab © 2009 - Yair Altman
This website and Octahedron Ltd. are not affiliated with The MathWorks Inc.; MATLAB® is a registered trademark of The MathWorks Inc.
Scroll to top