Undocumented Matlab
  • SERVICES
    • Consulting
    • Development
    • Training
    • Gallery
    • Testimonials
  • PRODUCTS
    • IQML: IQFeed-Matlab connector
    • IB-Matlab: InteractiveBrokers-Matlab connector
    • EODML: EODHistoricalData-Matlab connector
    • Webinars
  • BOOKS
    • Secrets of MATLAB-Java Programming
    • Accelerating MATLAB Performance
    • MATLAB Succinctly
  • ARTICLES
  • ABOUT
    • Policies
  • CONTACT

Plot LimInclude properties

March 31, 2010 9 Comments

Concluding my three-part mini-series on hidden and undocumented plot/axes properties, I would like to present a set of properties that I find very useful in dynamic plots: XLimInclude, YLimInclude, ZLimInclude, ALimInclude and CLimInclude. These properties, which are relevant for plot/axes objects, have an ‘on’ value by default. When set to ‘off’, they exclude their object from the automatic computation of the corresponding axes limits (XLim/YLim/ZLim/ALim/CLim).
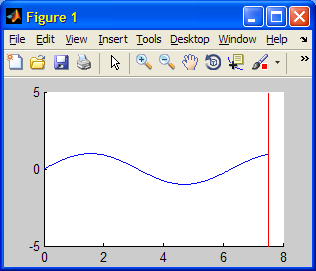
For example, here’s a simple sine wave with a wavefront line marker. Note how the too-tall wavefront line affects the entire axes Y-limits:

cla;
t=0:.01:7.5;
plot(t,sin(t));
line('xdata',[7.5,7.5], 'ydata',[-5,5], 'color','r');
box off

cla; t=0:.01:7.5; plot(t,sin(t)); line('xdata',[7.5,7.5], 'ydata',[-5,5], 'color','r'); box off

Regular plot (YLimInclude on)

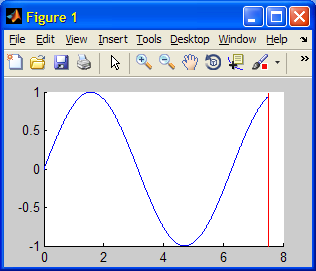
This situation is quickly fixed using the YLimInclude property:

cla;
t=0:.01:7.5;
plot(t,sin(t));
line('xdata',[7.5,7.5], 'ydata',[-5,5], 'color','r', ...
     'YLimInclude','off');
box off

cla; t=0:.01:7.5; plot(t,sin(t)); line('xdata',[7.5,7.5], 'ydata',[-5,5], 'color','r', ... 'YLimInclude','off'); box off

YLimInclude off
YLimInclude off

Beside the functional importance of this feature, it also has a large potential for improved application performance: I recently designed a monitor-like GUI for a medical application, where the data is constantly updated from an external sensor connected to the computer. The GUI presents the latest 10 seconds of monitored data, which bounce up and down the chart. A red wave-front line is presented and constantly updated, to indicate the current data position. Since the monitored data jumps up and down, the Y-limits of the monitor chart often changes, and with it I would need to modify the wavefront’s YData based on the updated axes YLim. This turned out to steal precious CPU time from the actual monitoring application. Came YLimInclude to the rescue, by letting me specify the wavefront line as:

hWavefront = line(..., 'YData',[-99,99], 'YLimInclude','off');

hWavefront = line(..., 'YData',[-99,99], 'YLimInclude','off');

Now the wavefront line never needed to update its YData (only XData, which is much less CPU-intensive) – it always spanned the entire axes height, since [-99,99] were assured (in my particular case) to exceed the actual monitored data. This looked better (no flicker effects) and performed faster than the regular (documented) approach.
Note that although all these properties exist, to the best of my knowledge, for all Handle-Graphic plot objects, they are sometimes meaningless. For example, ZLimInclude is irrelevant for a 2D patchless plot; CLimInclude relates to the axes color limits which are irrelevant if you’re not using a colormap or something similar; ALimInclude relates to patch transparency (alpha-channel) and is irrelevant elsewhere. In these and similar cases, setting these properties, while allowed and harmless, will simply have no effect.
This concludes my mini-series of undocumented plot/axes properties. To recap, the other articles dealt with the LooseInset and LineSmoothing properties.
Have you found other similar properties or use-cases that you find useful? I will be most interested to read about them in the comments section below.

Related posts:

  1. Borderless button used for plot properties – A borderless button can be used to add unobtrusive functionality to plot axes...
  2. Bar plot customizations – Matlab bar charts can be customized in various nifty ways. ...
  3. Plot performance – Undocumented inner plot mechanisms can significantly improve plotting performance ...
  4. Controlling plot data-tips – Data-tips are an extremely useful plotting tool that can easily be controlled programmatically....
  5. Accessing plot brushed data – Plot data brushing can be accessed programmatically using very simple pure-Matlab code...
  6. getundoc – get undocumented object properties – getundoc is a very simple utility that displays the hidden (undocumented) properties of a specified handle object....
Handle graphics Hidden property Performance Pure Matlab Undocumented feature Undocumented property
Print Print
« Previous
Next »
9 Responses
  1. Matt Whitaker March 31, 2010 at 14:42 Reply

    Hi Yair,
    Thanks, I think this will be very useful when you have a lot of graphics objects on the axes but you know what the overall dimensions will be. I’ll be trying this tip out right away.

    Perhaps you could expand on why you would use this in place of setting the YLImMode as in:

    cla;
    t=0:.01:7.5;
    plot(t,sin(t));
     
    lineHdl = line('xdata',[7.5,7.5], 'ydata',[-5,5], 'color','r'); 
    set(gca,'YLim',[-1,1],'YLimMode','manual');
    box off
     
    pause(3);
     
    %move the line
    set(lineHdl,'XData',[10,10]);

    cla; t=0:.01:7.5; plot(t,sin(t)); lineHdl = line('xdata',[7.5,7.5], 'ydata',[-5,5], 'color','r'); set(gca,'YLim',[-1,1],'YLimMode','manual'); box off pause(3); %move the line set(lineHdl,'XData',[10,10]);

    • Yair Altman March 31, 2010 at 22:56 Reply

      @Matt – that’s exactly the point: I want the limits to remain automatic and be updated with the plot data – I just don’t want some particular elements, like the wavefront line, to influence the limits. In your solution, if I now modify the plot data, the axes limits will remain fixed at they previous state.

    • Matt Whitaker April 1, 2010 at 08:29 Reply

      Ok got it now.

      So if I run the code below it illustrates the point:

      cla;
      t=0:.01:7.5;
      lineHdl = plot(t,sin(t));
      line('xdata',[7.5,7.5], 'ydata',[-5,5], 'color','r', ...
           'YLimInclude','off'); 
      box off
       
      pause(2)
      set(lineHdl,'YData',2*sin(t));

      cla; t=0:.01:7.5; lineHdl = plot(t,sin(t)); line('xdata',[7.5,7.5], 'ydata',[-5,5], 'color','r', ... 'YLimInclude','off'); box off pause(2) set(lineHdl,'YData',2*sin(t));

      • Yair Altman April 1, 2010 at 11:28

        exactly – thanks for the clarification example

  2. Matt Whitaker August 6, 2010 at 15:26 Reply

    Hi Yair,
    Glad I remembered this tip. Had a plot with 50+ draggable lines on it that updated other plots. Much smoother when I remembered this tip and turned off the XLimInclude , YLimInclude for the draggable lines and the line plot they were updating.

    Thanks
    Matt

  3. Yair Altman January 14, 2011 at 03:54 Reply

    For anyone interested, there appears to be an anomaly when using the LimInclude properties with hgtransform: https://www.mathworks.com/matlabcentral/newsreader/view_thread/295878#812396

    – Yair

  4. datestr performance | Undocumented Matlab October 5, 2011 at 13:20 Reply

    […] Different performance hotspots can have different solutions: caching, vectorization, internal library functions, undocumented graphics properties, smart property selection, smart function selection, smart indexing, smart parameter selection etc. […]

  5. HG2 update | Undocumented Matlab May 16, 2013 at 07:54 Reply

    […] axes no longer have *LimInclude properties (this actually makes sense – these properties are still available in plot lines […]

  6. Customizing axes part 2 | Undocumented Matlab October 22, 2014 at 11:03 Reply

    […] In HG1, we could do this programmatically using extra line commands (presumably with the additional *LimInclude properties). In HG2 it becomes easier – we can simply update the relevant baseline’s properties: […]

Leave a Reply
HTML tags such as <b> or <i> are accepted.
Wrap code fragments inside <pre lang="matlab"> tags, like this:
<pre lang="matlab">
a = magic(3);
disp(sum(a))
</pre>
I reserve the right to edit/delete comments (read the site policies).
Not all comments will be answered. You can always email me (altmany at gmail) for private consulting.

Click here to cancel reply.

Useful links
  •  Email Yair Altman
  •  Subscribe to new posts (feed)
  •  Subscribe to new posts (reader)
  •  Subscribe to comments (feed)
 
Accelerating MATLAB Performance book
Recent Posts

Speeding-up builtin Matlab functions – part 3

Improving graphics interactivity

Interesting Matlab puzzle – analysis

Interesting Matlab puzzle

Undocumented plot marker types

Matlab toolstrip – part 9 (popup figures)

Matlab toolstrip – part 8 (galleries)

Matlab toolstrip – part 7 (selection controls)

Matlab toolstrip – part 6 (complex controls)

Matlab toolstrip – part 5 (icons)

Matlab toolstrip – part 4 (control customization)

Reverting axes controls in figure toolbar

Matlab toolstrip – part 3 (basic customization)

Matlab toolstrip – part 2 (ToolGroup App)

Matlab toolstrip – part 1

Categories
  • Desktop (45)
  • Figure window (59)
  • Guest bloggers (65)
  • GUI (165)
  • Handle graphics (84)
  • Hidden property (42)
  • Icons (15)
  • Java (174)
  • Listeners (22)
  • Memory (16)
  • Mex (13)
  • Presumed future risk (394)
    • High risk of breaking in future versions (100)
    • Low risk of breaking in future versions (160)
    • Medium risk of breaking in future versions (136)
  • Public presentation (6)
  • Semi-documented feature (10)
  • Semi-documented function (35)
  • Stock Matlab function (140)
  • Toolbox (10)
  • UI controls (52)
  • Uncategorized (13)
  • Undocumented feature (217)
  • Undocumented function (37)
Tags
AppDesigner (9) Callbacks (31) Compiler (10) Desktop (38) Donn Shull (10) Editor (8) Figure (19) FindJObj (27) GUI (141) GUIDE (8) Handle graphics (78) HG2 (34) Hidden property (51) HTML (26) Icons (9) Internal component (39) Java (178) JavaFrame (20) JIDE (19) JMI (8) Listener (17) Malcolm Lidierth (8) MCOS (11) Memory (13) Menubar (9) Mex (14) Optical illusion (11) Performance (78) Profiler (9) Pure Matlab (187) schema (7) schema.class (8) schema.prop (18) Semi-documented feature (6) Semi-documented function (33) Toolbar (14) Toolstrip (13) uicontrol (37) uifigure (8) UIInspect (12) uitable (6) uitools (20) Undocumented feature (187) Undocumented function (37) Undocumented property (20)
Recent Comments
Contact us
Captcha image for Custom Contact Forms plugin. You must type the numbers shown in the image
Undocumented Matlab © 2009 - Yair Altman
This website and Octahedron Ltd. are not affiliated with The MathWorks Inc.; MATLAB® is a registered trademark of The MathWorks Inc.
Scroll to top