Useful links
Recent Posts
- Improving graphics interactivity
- Interesting Matlab puzzle – analysis
- Interesting Matlab puzzle
- Undocumented plot marker types
- Matlab toolstrip – part 9 (popup figures)
- Matlab toolstrip – part 8 (galleries)
- Matlab toolstrip – part 7 (selection controls)
- Matlab toolstrip – part 6 (complex controls)
- Matlab toolstrip – part 5 (icons)
- Matlab toolstrip – part 4 (control customization)
- Reverting axes controls in figure toolbar
- Matlab toolstrip – part 3 (basic customization)
- Matlab toolstrip – part 2 (ToolGroup App)
- Matlab toolstrip – part 1
- Matlab callbacks for uifigure JavaScript events
Archives
Categories
- Desktop (45)
- Figure window (59)
- Guest bloggers (65)
- GUI (165)
- Handle graphics (84)
- Hidden property (42)
- Icons (15)
- Java (174)
- Listeners (22)
- Memory (16)
- Mex (13)
- Presumed future risk (393)
- Public presentation (6)
- Semi-documented feature (10)
- Semi-documented function (35)
- Stock Matlab function (139)
- Toolbox (9)
- UI controls (52)
- Uncategorized (13)
- Undocumented feature (217)
- Undocumented function (37)
Tags
AppDesigner Callbacks COM Compiler Desktop Donn Shull Editor Figure FindJObj GUI GUIDE Handle graphics HG2 Hidden property HTML Icons Internal component Java JavaFrame JIDE JMI Listener Malcolm Lidierth MCOS Memory Menubar Mex Optical illusion Performance Profiler Pure Matlab schema schema.class schema.prop Semi-documented feature Semi-documented function Toolbar Toolstrip uicontrol uifigure UIInspect uitools Undocumented feature Undocumented function Undocumented propertyRecent Comments
- Antonio (4 days 12 hours ago): Note Intel’s MKL implementations of BLAS/LAPACK are already multi-threaded, so it is likely that you won’t achieve a vast improvement (the overall performance could even...
- Testing 123 (242 days 4 hours ago): The mexCallMATLAB function raises interesting possibilities for parallelization. I spent a few hours (days…) writing a mexFunction that mimics the functionality of...
- Andrés Aguilar (381 days 2 hours ago): Hello, has anyone tried to change the language of the DateComboBox? For example English -> French ————&# 8212;—- January -> Janvier April...
- Yair Altman (673 days 6 hours ago): You didn’t say what code you were trying to run and what exactly didn’t work for you, so I cannot help you. In general I can say that the code still works ok on...
- Nicholas (675 days 3 hours ago): It has come to my attention that in R2022a the content for HtmlText and CurrentLocation cannot be set for an HTMLBrowserPanel object. This can be easily demonstrated in R2022a with...
- bryan taylor (676 days 10 hours ago): I’m using matlab r2021a. The command above don’t seem to work. The commands run without error but the changes do no effect the text box.
- Yair Altman (693 days 11 hours ago): @Mitchell – in most cases the user wants a single string identifier for the computer, that uniquely identifies it with a distinct fingerprint that is different from any other...
- Mitchell (693 days 19 hours ago): Great post! I’m not very familiar with the network interfaces being referenced here, but it seems like the java-based cross-platform method concatenates all network...
- Eric (742 days 8 hours ago): this save me a lot of time, thank you very much!
- Yair Altman (1064 days 4 hours ago): You forgot to wait for the figure and the axes to fully render. After a pause and drawnow the code works ok (at least in R2021a).
- Anton Semechko (1064 days 4 hours ago): Hi, Yair, Do you know why is it impossible to add listeners to any of the uiobjects in UIFigure? And is there some way to work around this limitation? For example:...
- Davide Coluzzi (1099 days 3 hours ago): Hello, I have just found out this website and the book, they are great! Many thanks for this. I am developing a GUI in Matlab and I added a uiimage to receive info, so that...
- Yair Altman (1216 days 9 hours ago): drawnow is the entry function to Matlab graphics updates, which chains numerous internal drawing/painting calls, as well as associated callbacks (internal and user-defined)....
- Ondrej (1216 days 10 hours ago): Hi Yair, I have a slightly off-topic question. I am using Matlab 2017a and when using drawnow to refresh the graphics I noticed in the profiler (with -memory option on) this: Code...
- Florian (1447 days 17 hours ago): Hello Yair thank you for this work. I am trying to using the sorting function but obviously it treat my ‘double’ as ‘string’. Then the sorting of the numbers...
Contact Us
Matlab toolstrip – part 3 (basic customization)
In the previous post I showed how we can create custom Matlab apps. In such apps, the toolstrip is very often an important part. Today I continue my miniseries on toolstrips. Toolstrips can be a bit complex so I’m trying to proceed slowly, with each post in the miniseries building on the previous posts. So I encourage you to review the earlier posts in the miniseries (part1, part2) before reading this post.
A Matlab toolstrip is composed of a hierarchy of user-interface objects as follows (all objects are classes within the matlab.ui.internal.toolstrip package):
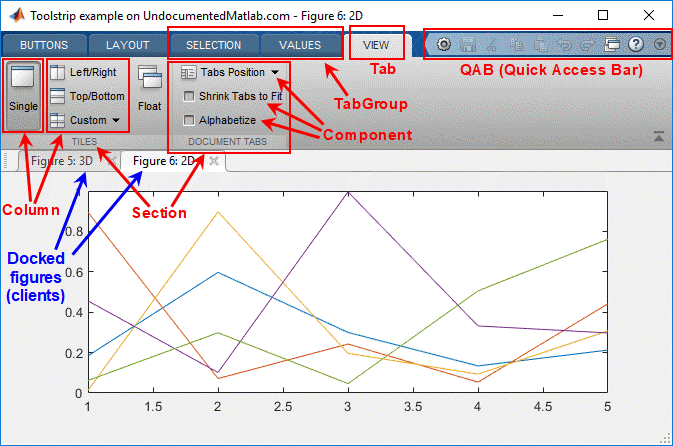
Anatomy of a Matlab app with toolstrip
- TabGroup
- Tab
- Section
- Column
- Component
- Component
- …
- Component
- Column
- …
- Column
- Section
- …
- Section
- Tab
- …
- Tab
- TabGroup
- …
In this post I explain how we can create a custom toolstrip that contains tabs, sections, and basic controls that interact with the user and the docked figures. The following posts will show more advanced customizations and more complex controls, as well as showing alternative ways of creating the toolstrip.
Categories: Figure window, GUI, High risk of breaking in future versions, Undocumented feature
Tags: Figure, GUI, Toolstrip, Undocumented feature
21 Comments
Tags: Figure, GUI, Toolstrip, Undocumented feature
21 Comments
Matlab toolstrip – part 2 (ToolGroup App)
A while ago I posted the first of my planned miniseries on the Matlab toolstrip (ribbon). Today I will expand that post by discussing how toolstrips can be added to Matlab GUIs. This post will remain at a high-level as the previous post, with followup posts drilling into the technical details of the toolstrip components (inner packages and classes).
We can add a Matlab toolstrip to 3 types of Matlab GUI windows:
- To a Java-based Matlab figure (so-called “legacy” figures, created using GUIDE or the figure function)
- To a container window of docked Java-based figures, typically called an “App” (marketing name) or “Tool Group” (internal technical name)
- To a JavaScript/HTML-based Matlab figure (so called “web” figures, created using App Designer or the uifigure function)
Today I will show how to add a basic dynamic toolstrip to a ToolGroup (App, window type #2):
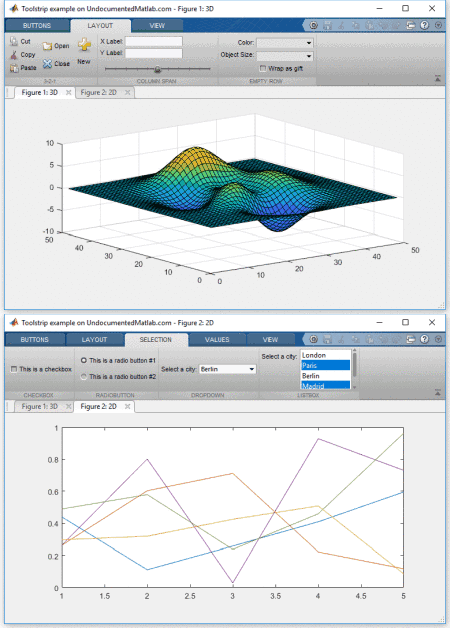
ToolGroup with clients and dynamic toolstrip
Continue reading
Categories: Desktop, Figure window, GUI, High risk of breaking in future versions, Java, Undocumented feature
Tags: Figure, GUI, schema.prop, Toolstrip, Undocumented feature
11 Comments
Tags: Figure, GUI, schema.prop, Toolstrip, Undocumented feature
11 Comments
Matlab toolstrip – part 1
The Matlab toolstrip (ribbon) has been around officially since R2012a, and unofficially for a couple of years earlier. Since then, I blogged about the toolstrip only rarely (example). I believe the time has come to start a short mini-series about this functionality, eventually showing how users can use toolstrips in their own custom applications.
My plan is to start the miniseries with a discussion of the built-in showcase examples, followed by a post on the built-in classes that make up the toolstrip building-blocks. Finally, I’ll describe how toolstrips can be added to figures, not just in client/tool groups.
Matlab’s internal showcase examples
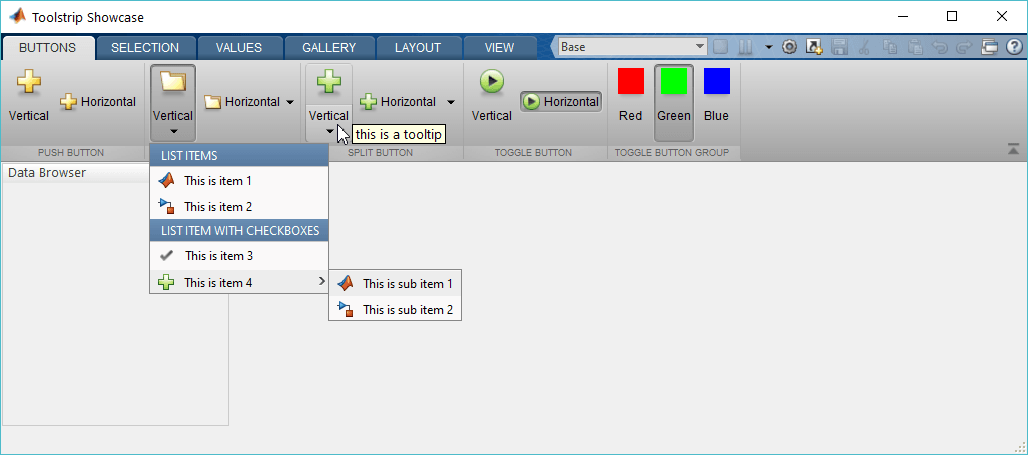
I start the discussion with a description of built-in examples for the toolstrip functionality, located in %matlabroot%/toolbox/matlab/toolstrip/+matlab/+ui/+internal/+desktop/. The most important of these are showcaseToolGroup.m and showcaseMPCDesigner.m, both of which use Java-based (Swing) containers and controls. Readers who wish to integrate toolstrips into their app immediately, without waiting for my followup posts in this series, are welcome to dig into the examples’ source-code and replicate it in their programs:
1. showcaseToolGroup
h = matlab.ui.internal.desktop.showcaseToolGroup
Continue reading
Categories: Desktop, GUI, High risk of breaking in future versions, Semi-documented feature
Tags: Desktop, GUI, Semi-documented feature, Toolstrip
5 Comments
Tags: Desktop, GUI, Semi-documented feature, Toolstrip
5 Comments
Matlab callbacks for uifigure JavaScript events
I would like to welcome back guest blogger Iliya Romm of Israel’s Technion Turbomachinery and Heat Transfer Laboratory. Today Iliya will discuss how to assign Matlab callbacks to JavaScript events in the new web-based uifigures. Other posts on customizations of web-based Matlab GUI can be found here.
On several occasions (including the previous post by Khris Griffis) I came across people who were really missing the ability to have Matlab respond to various JavaScript (JS) events. While MathWorks are working on their plans to incorporate something similar to this in future releases, we’ll explore the internal tools already available, in the hopes of finding a suitable intermediate solution.
Today I’d like to share a technique I’ve been experimenting with, allowing Matlab to respond to pretty much any JS event to which we can attach a listener. This is an overview of how it works:
- create a UIFigure with the desired contents, and add to it (at least) one more dummy control, which has an associated Matlab callback.
- execute a JS snippet that programmatically interacts with the dummy control, whenever some event-of-interest happens, causing the Matlab callback to fire.
- query the
webWindow, from within the Matlab callback, to retrieve any additional information (“payload”) that the JS passed.
This approach allows, for example, to easily respond to mouse events:

Continue reading
Customizing web-GUI uipanel
I would like to introduce guest blogger Khris Griffis. Today, Khris will continue the series of posts on web-based uifigure customization with an article showing how to create scrollable/customizable panels in web-based uifigures. This post follows last-week’s article, about placing controls/axes within a scroll-panel in non-web (Java-based) figures. Users interested in advanced aspects and insights on the development roadmap of web-based Matlab GUI should also read Loren Shure’s blog post from last week.
Motivation
As a retinal physiologist, I spend a lot of time in Matlab creating GUIs to visualize and analyze electrophysiological data. The data often requires a lot of processing and quality control checks before it can be used for interpretation and publication. Consequently, I end up with many control elements taking up precious space on my GUI.
In Java-based (legacy/GUIDE) figures, this wasn’t a huge problem because, depending on what GUI components I needed, I could use a pure Matlab approach (a child panel within a parent panel, with a couple of control sliders moving the child panel around), or a number of Java approaches (which are always more fun; Yair described such an approach last week).
Unfortunately, the web-based (App-Designer) figure framework doesn’t support Java, and the pure/documented Matlab approach just doesn’t look good or function very well:
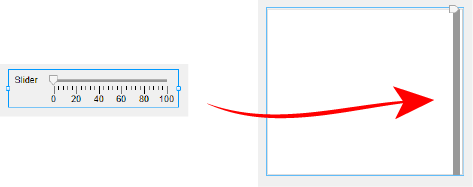
AppDesigner uislider is not a good scrollbar, no matter what we do to it!
Fortunately, the new web framework allows us to use HTML, CSS and JavaScript (JS) to modify elements in the uifigure, i.e. its web-page DOM. It turns out that the uipanel object is essentially just a <div> with a Matlab-designed CSS style. We can customize it with little effort.
The main goal here is to create a scrollable customizable uipanel containing many uicontrol elements, which could look something like this:
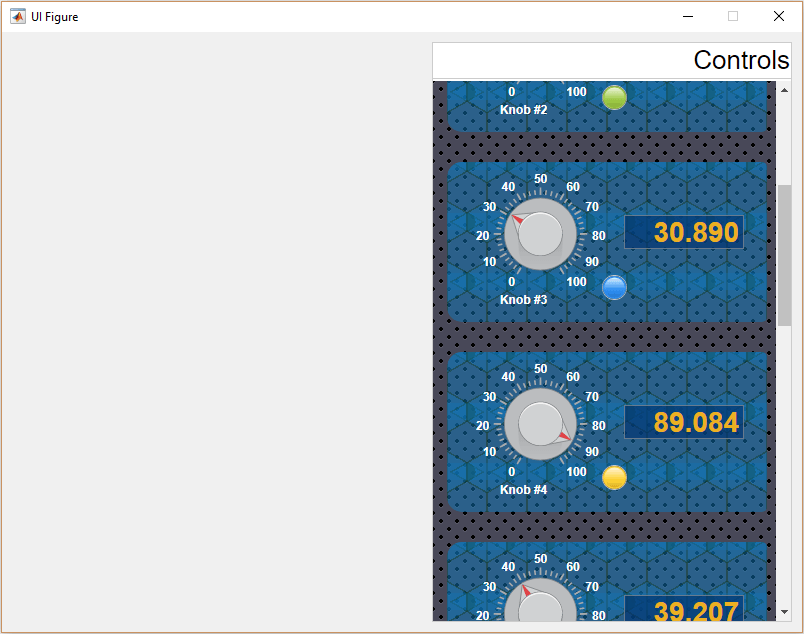
Continue reading
Scrollable GUI panels
Matlab enables two types of GUI container types, via the Units property: fixed-size ('pixels', 'chars', etc.) and flexible ('normalized'). In many cases, we need something in between: a panel that expands dynamically when its container grows (i.e., flexible/normalized), and displays scroll-bars when the container shrinks (i.e., fixed size, with a scrollable viewport). This functionality is relatively easy to achieve using a bit of undocumented magic powder. Today’s post will show how to do this with legacy (Java-based) figures, and next week’s post will do the same for web-based (JavaScript) uifigures.
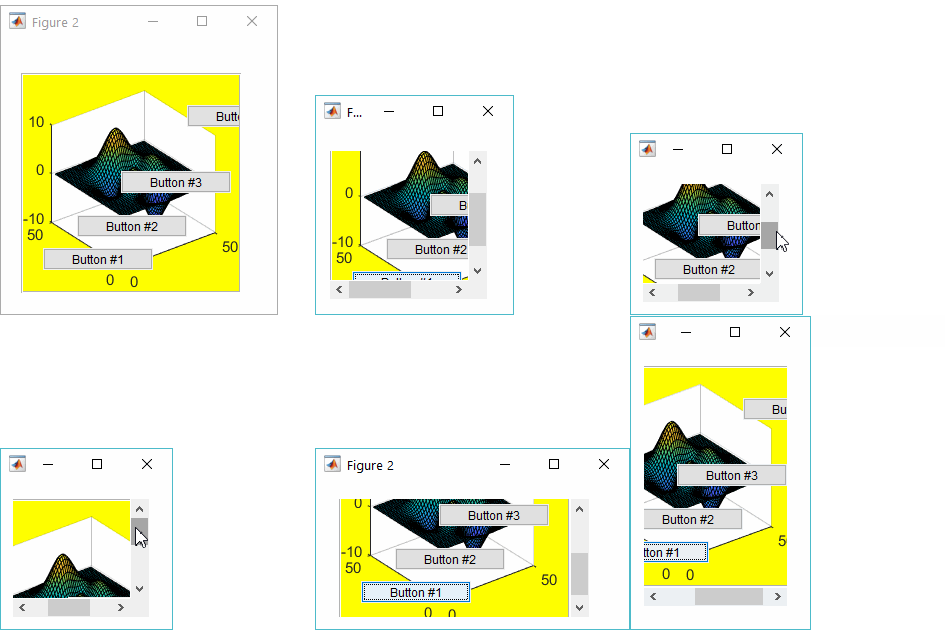
Scrollable Matlab GUI panel
Categories: GUI, Java, Medium risk of breaking in future versions, Undocumented feature
Tags: GUI, Java, uipanel, Undocumented feature
1 Comment
Tags: GUI, Java, uipanel, Undocumented feature
1 Comment
Multi-threaded Mex
I was recently asked by a consulting client to help speed up a Matlab process.  Quite often there are various ways to improve the run-time, and in this particular case it turned out that the best option was to convert the core Matlab processing loop into a multi-threaded Mex function, while keeping the rest (vast majority of program code) in easy-to-maintain Matlab. This resulted in a 160x speedup (25 secs => 0.16 secs). Some of this speedup is attributed to C-code being faster in general than Matlab, another part is due to the multi-threading, and another due to in-place data manipulations that avoid costly memory access and re-allocations.
In today’s post I will share some of the insights relating to this MEX conversion, which could be adapted for many other similar use-cases. Additional Matlab speed-up techniques can be found in other performance-related posts on this website, as well in my book Accelerating MATLAB Performance.
There are quite a few online resources about creating Mex files, so I will not focus on this aspect. I’ll assume that the reader is already familiar with the concept of using Mex functions, which are simply dynamically-linked libraries that have a predefined entry-function syntax and predefined platform-specific extension. Instead, I’ll focus on how to create and debug a multi-threaded Mex function, so that it runs in parallel on all CPU cores.
The benefit of multi-threading is that threads are very light-weight objects, that have minimal performance and memory overheads. This contrasts to multi-tasking, which is what the Parallel Computing Toolbox currently does: launches duplicate copies of the entire Matlab engine process (“headless workers”) and then manages and coordinates the tasks to split up the processing work. Multi-tasking should be avoided wherever we can employ light-weight multi-threading instead. Unfortunately, Matlab does not currently have the ability to explicitly multi-thread Matlab code. But we can still use explicit multi-threading by invoking code in other languages, as I’ve already shown for Java, C# (and .NET in general), and C/C++. Today’s article will expand on the latter post (the one about C/C++ multi-threading), by showing a general framework for making a multi-threaded C-based Mex function.
Continue reading
Categories: Low risk of breaking in future versions, Mex, Undocumented feature
Tags: Mex, Performance, Undocumented feature
6 Comments
Tags: Mex, Performance, Undocumented feature
6 Comments
Plot legend customization
Three years ago I explained how we can use a couple of undocumented hidden properties of the legend in order to add a legend title (the legend object had no Title property back then – this was only added in a later Matlab release, perhaps as a result of my post). Today I will expand on that article by explaining the plot legend’s internal graphics hierarchy, how we can access each of these components, and then how this information could be used to customize the separate legend components. Note that the discussion today is only relevant for HG2 legends (i.e. R2014b or newer).
Let’s start with a simple Matlab plot with a legend:
hold all;
hLine1 = plot(1:5);
hLine2 = plot(2:6);
hLegend = legend([hLine1,hLine2], 'Location','SouthEast');
hLegend.Title.String = 'MyLegend';
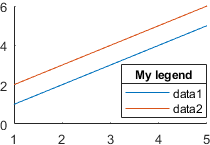
Standard Matlab legend
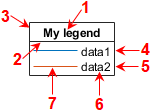
Continue reading
Sliders in Matlab GUI – part 2
Exactly 3 years ago I posted about various alternatives for embedding sliders in Matlab GUI. Today I will follow up on that post with a description of yet another undocumented builtin alternative – controllib.widget.Slider. A summary of the various alternatives can be seen in the following screenshot:
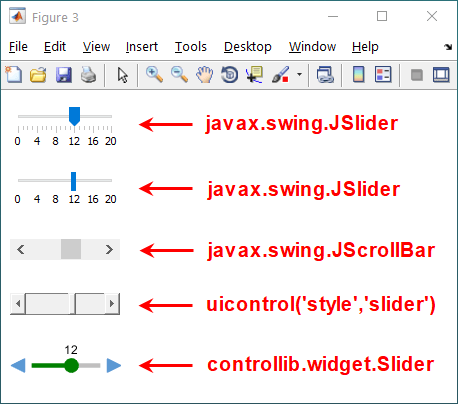
Slider alternatives in Matlab GUI
The controllib.widget.Slider component is a class in Matlab’s internal controllib package (last week I discussed a different utility function in this package, controllib.internal.util.hString2Char).
Continue reading
Categories: GUI, Medium risk of breaking in future versions, Semi-documented function
Tags: GUI, Internal component, Pure Matlab
6 Comments
Tags: GUI, Internal component, Pure Matlab
6 Comments
