Useful links
Recent Posts
- Improving graphics interactivity
- Interesting Matlab puzzle – analysis
- Interesting Matlab puzzle
- Undocumented plot marker types
- Matlab toolstrip – part 9 (popup figures)
- Matlab toolstrip – part 8 (galleries)
- Matlab toolstrip – part 7 (selection controls)
- Matlab toolstrip – part 6 (complex controls)
- Matlab toolstrip – part 5 (icons)
- Matlab toolstrip – part 4 (control customization)
- Reverting axes controls in figure toolbar
- Matlab toolstrip – part 3 (basic customization)
- Matlab toolstrip – part 2 (ToolGroup App)
- Matlab toolstrip – part 1
- Matlab callbacks for uifigure JavaScript events
Archives
Categories
- Desktop (45)
- Figure window (59)
- Guest bloggers (65)
- GUI (165)
- Handle graphics (84)
- Hidden property (42)
- Icons (15)
- Java (174)
- Listeners (22)
- Memory (16)
- Mex (13)
- Presumed future risk (393)
- Public presentation (6)
- Semi-documented feature (10)
- Semi-documented function (35)
- Stock Matlab function (139)
- Toolbox (9)
- UI controls (52)
- Uncategorized (13)
- Undocumented feature (217)
- Undocumented function (37)
Tags
AppDesigner Callbacks COM Compiler Desktop Donn Shull Editor Figure FindJObj GUI GUIDE Handle graphics HG2 Hidden property HTML Icons Internal component Java JavaFrame JIDE JMI Listener Malcolm Lidierth MCOS Memory Menubar Mex Optical illusion Performance Profiler Pure Matlab schema schema.class schema.prop Semi-documented feature Semi-documented function Toolbar Toolstrip uicontrol uifigure UIInspect uitools Undocumented feature Undocumented function Undocumented propertyRecent Comments
- Testing 123 (229 days 23 hours ago): The mexCallMATLAB function raises interesting possibilities for parallelization. I spent a few hours (days…) writing a mexFunction that mimics the functionality of...
- Andrés Aguilar (368 days 22 hours ago): Hello, has anyone tried to change the language of the DateComboBox? For example English -> French ————&# 8212;—- January -> Janvier April...
- Yair Altman (661 days 1 hour ago): You didn’t say what code you were trying to run and what exactly didn’t work for you, so I cannot help you. In general I can say that the code still works ok on...
- Nicholas (662 days 22 hours ago): It has come to my attention that in R2022a the content for HtmlText and CurrentLocation cannot be set for an HTMLBrowserPanel object. This can be easily demonstrated in R2022a with...
- bryan taylor (664 days 5 hours ago): I’m using matlab r2021a. The command above don’t seem to work. The commands run without error but the changes do no effect the text box.
- Yair Altman (681 days 6 hours ago): @Mitchell – in most cases the user wants a single string identifier for the computer, that uniquely identifies it with a distinct fingerprint that is different from any other...
- Mitchell (681 days 15 hours ago): Great post! I’m not very familiar with the network interfaces being referenced here, but it seems like the java-based cross-platform method concatenates all network...
- Eric (730 days 3 hours ago): this save me a lot of time, thank you very much!
- Yair Altman (1051 days 23 hours ago): You forgot to wait for the figure and the axes to fully render. After a pause and drawnow the code works ok (at least in R2021a).
- Anton Semechko (1052 days 0 hours ago): Hi, Yair, Do you know why is it impossible to add listeners to any of the uiobjects in UIFigure? And is there some way to work around this limitation? For example:...
- Davide Coluzzi (1086 days 23 hours ago): Hello, I have just found out this website and the book, they are great! Many thanks for this. I am developing a GUI in Matlab and I added a uiimage to receive info, so that...
- Yair Altman (1204 days 5 hours ago): drawnow is the entry function to Matlab graphics updates, which chains numerous internal drawing/painting calls, as well as associated callbacks (internal and user-defined)....
- Ondrej (1204 days 5 hours ago): Hi Yair, I have a slightly off-topic question. I am using Matlab 2017a and when using drawnow to refresh the graphics I noticed in the profiler (with -memory option on) this: Code...
- Florian (1435 days 13 hours ago): Hello Yair thank you for this work. I am trying to using the sorting function but obviously it treat my ‘double’ as ‘string’. Then the sorting of the numbers...
- BPoliti (1610 days 5 hours ago): Hi, Thank you for the very nice article! It has helped me a lot and works like a charm
 One thing with the modified code is that it is necessary to add an attachment to send an...
Contact Us
Interesting Matlab puzzle – analysis
Last week I presented a seemingly-innocent Matlab code snippet with several variants, and asked readers to speculate what its outcomes are, and why. Several readers were apparently surprised by the results. In today’s post, I offer my analysis of the puzzle.
The original code snippet was this:
function test
    try
        if (false) or (true)            disp('Yaba');
        else
            disp('Daba');
        end
    catch
        disp('Doo!');
    end
end
With the following variants for the highlighted line #3:
        if (false) or (true)     % variant #1 (original)
        if (true)  or (false)    % variant #2
        if (true)  or (10< 9.9)  % variant #3
        if  true   or  10< 9.9   % variant #4
        if 10> 9.9 or  10< 9.9   % variant #5
Interesting Matlab puzzle
Here’s a nice little puzzle that came to me from long-time Matlab veteran Andrew Janke:
Without actually running the following code in Matlab, what do you expect its output to be? ‘Yaba’? ‘Daba’? perhaps ‘Doo!’? or maybe it won’t run at all because of a parsing error?
function test
    try
        if (false) or (true)
            disp('Yaba');
        else
            disp('Daba');
        end
    catch
        disp('Doo!');
    end
end
To muddy the waters a bit, do you think that short-circuit evaluation is at work here? or perhaps eager evaluation? or perhaps neither?
Would the results be different if we switched the order of the conditional operands, i.e. (true) or (false) instead of (false) or (true)? if so, how and why?
And does it matter if I used “false” or “10< 9.9” as the “or” conditional?
Are the parentheses around the conditions important? would the results be any different without these parentheses?
In other words, how and why would the results change for the following variants?
        if (false) or (true)     % variant #1
        if (true)  or (false)    % variant #2
        if (true)  or (10< 9.9)  % variant #3
        if  true   or  10< 9.9   % variant #4
        if 10> 9.9 or  10< 9.9   % variant #5
Please post your thoughts in a comment below (expected results and the reason, for the main code snippet above and its variants), and then run the code. You might be surprised at the results, but not less importantly at the reasons. This deceivingly innocuous code snippet leads to interesting insight on Matlab’s parser.
Full marks will go to the first person who posts the correct results and reasoning/interpretation of the variants above (hint: it’s not as trivial as it might look at first glance).
Addendum April 9, 2019: I have now posted my solution/analysis of this puzzle here.
USA visit
I will be travelling in the US (Boston, New York, Baltimore) in May/June 2019. Please let me know (altmany at gmail) if you would like to schedule a meeting or onsite visit for consulting/training, or perhaps just to explore the possibility of my professional assistance to your Matlab programming needs.
Undocumented plot marker types
I wanted to take a break from my miniseries on the Matlab toolstrip to describe a nice little undocumented aspect of plot line markers. Plot line marker types have remained essentially unchanged in user-facing functionality for the past two+ decades, allowing the well-known marker types (.,+,o,^ etc.). Internally, lots of things changed in the graphics engine, particularly in the transition to HG2 in R2014b and the implementation of markers using OpenGL primitives. I suspect that during the massive amount of development work that was done at that time, important functionality improvements that were implemented in the engine were forgotten and did not percolate all the way up to the user-facing functions. I highlighted a few of these in the past, for example transparency and color gradient for plot lines and markers, or various aspects of contour plots.
Fortunately, Matlab usually exposes the internal objects that we can customize and which enable these extra features, in hidden properties of the top-level graphics handle. For example, the standard Matlab plot-line handle has a hidden property called MarkerHandle that we can access. This returns an internal object that enables marker transparency and color gradients. We can also use this object to set the marker style to a couple of formats that are not available in the top-level object:
>> x=1:10; y=10*x; hLine=plot(x,y,'o-'); box off; drawnow;
>> hLine.MarkerEdgeColor = 'r';

>> set(hLine, 'Marker')'  % top-level marker styles
ans =
  1×14 cell array
    {'+'} {'o'} {'*'} {'.'} {'x'} {'square'} {'diamond'} {'v'} {'^'} {'>'} {'<'} {'pentagram'} {'hexagram'} {'none'}

>> set(hLine.MarkerHandle, 'Style')'  % low-level marker styles
ans =
  1×16 cell array
    {'plus'} {'circle'} {'asterisk'} {'point'} {'x'} {'square'} {'diamond'} {'downtriangle'} {'triangle'} {'righttriangle'} {'lefttriangle'} {'pentagram'} {'hexagram'} {'vbar'} {'hbar'} {'none'}
We see that the top-level marker styles directly correspond to the low-level styles, except for the low-level ‘vbar’ and ‘hbar’ styles. Perhaps the developers forgot to add these two styles to the top-level object in the enormous upheaval of HG2. Luckily, we can set the hbar/vbar styles directly, using the line’s MarkerHandle property:
hLine.MarkerHandle.Style = 'hbar';
set(hLine.MarkerHandle, 'Style','hbar');  % alternative
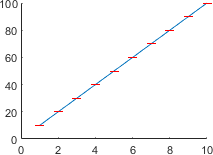
hLine.MarkerHandle.Style='hbar'
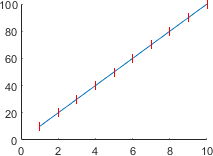
hLine.MarkerHandle.Style='vbar'
USA visit
I will be travelling in the US in May/June 2019. Please let me know (altmany at gmail) if you would like to schedule a meeting or onsite visit for consulting/training, or perhaps just to explore the possibility of my professional assistance to your Matlab programming needs.
Matlab toolstrip – part 9 (popup figures)
In previous posts I showed how we can create custom Matlab app toolstrips using various controls. Today I will show how we can incorporate popup forms composed of Matlab figures into our Matlab toolstrip. These are similar in concept to drop-down and gallery selectors, in the sense that when we click the toolstrip button a custom popup is displayed. In the case of a popup form, this is a fully-customizable Matlab GUI figure.
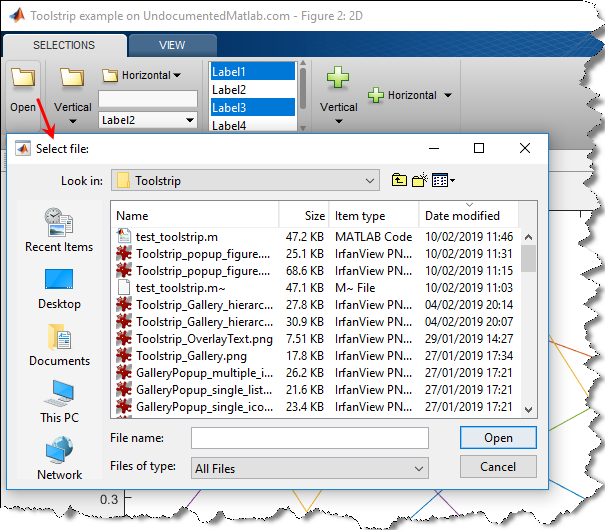
Toolstrips can be a bit complex to develop so I’m proceeding slowly, with each post in the miniseries building on the previous posts. Continue reading
Categories: Figure window, GUI, High risk of breaking in future versions, Java, Undocumented feature
Tags: Figure, GUI, Java, Toolstrip, Undocumented feature
5 Comments
Tags: Figure, GUI, Java, Toolstrip, Undocumented feature
5 Comments
Matlab toolstrip – part 8 (galleries)
In previous posts I showed how we can create custom Matlab app toolstrips using various controls (buttons, checkboxes, drop-downs, lists etc.). Today I will show how we can incorporate gallery panels into our Matlab toolstrip.

Toolstrips can be a bit complex to develop so I’m proceeding slowly, with each post in the miniseries building on the previous posts. I encourage you to review the earlier posts in the Toolstrip miniseries before reading this post.
Continue reading
Categories: Figure window, GUI, High risk of breaking in future versions, Undocumented feature
Tags: Figure, GUI, Toolstrip, Undocumented feature
5 Comments
Tags: Figure, GUI, Toolstrip, Undocumented feature
5 Comments
Matlab toolstrip – part 7 (selection controls)
In previous posts I showed how we can create custom Matlab app toolstrips using controls such as buttons, checkboxes, sliders and spinners. Today I will show how we can incorporate even more complex selection controls into our toolstrip: lists, drop-downs, popups etc.
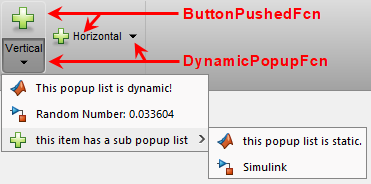
Toolstrip SplitButton with dynamic popup and static sub-menu
Toolstrips can be a bit complex to develop so I’m proceeding slowly, with each post in the miniseries building on the previous posts. I encourage you to review the earlier posts in the Toolstrip miniseries before reading this post.
Continue reading
Categories: Figure window, GUI, High risk of breaking in future versions, Undocumented feature
Tags: Figure, GUI, Toolstrip, Undocumented feature
6 Comments
Tags: Figure, GUI, Toolstrip, Undocumented feature
6 Comments
Matlab toolstrip – part 6 (complex controls)
In previous posts I showed how we can create custom Matlab app toolstrips using simple controls such as buttons and checkboxes. Today I will show how we can incorporate more complex controls into our toolstrip: button groups, edit-boxes, spinners, sliders etc.

Toolstrips can be a bit complex to develop so I’m proceeding slowly, with each post in the miniseries building on the previous posts. I encourage you to review the earlier posts in the Toolstrip miniseries before reading this post.
Continue reading
Categories: Figure window, GUI, High risk of breaking in future versions, UI controls, Undocumented feature
Tags: Figure, GUI, Toolstrip, Undocumented feature
4 Comments
Tags: Figure, GUI, Toolstrip, Undocumented feature
4 Comments
Matlab toolstrip – part 4 (control customization)
In a previous post I showed how we can create custom Matlab app toolstrips. Toolstrips can be a bit complex to develop so I’m trying to proceed slowly, with each post in the miniseries building on the previous posts. I encourage you to review the earlier posts in the Toolstrip miniseries before reading this post. In today’s post we continue the discussion of the toolstrip created in the previous post:
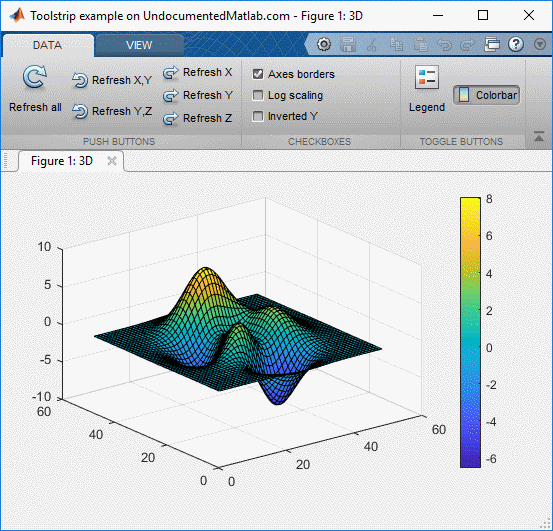
Toolstrip example (basic controls)
Today’s post will show how to attach user-defined functionality to toolstrip components, as well as some additional customizations. At the end of today’s article, you should be able to create a fully-functional custom Matlab toolstrip. Continue reading
