Useful links
Recent Posts
- Improving graphics interactivity
- Interesting Matlab puzzle – analysis
- Interesting Matlab puzzle
- Undocumented plot marker types
- Matlab toolstrip – part 9 (popup figures)
- Matlab toolstrip – part 8 (galleries)
- Matlab toolstrip – part 7 (selection controls)
- Matlab toolstrip – part 6 (complex controls)
- Matlab toolstrip – part 5 (icons)
- Matlab toolstrip – part 4 (control customization)
- Reverting axes controls in figure toolbar
- Matlab toolstrip – part 3 (basic customization)
- Matlab toolstrip – part 2 (ToolGroup App)
- Matlab toolstrip – part 1
- Matlab callbacks for uifigure JavaScript events
Archives
Categories
- Desktop (45)
- Figure window (59)
- Guest bloggers (65)
- GUI (165)
- Handle graphics (84)
- Hidden property (42)
- Icons (15)
- Java (174)
- Listeners (22)
- Memory (16)
- Mex (13)
- Presumed future risk (393)
- Public presentation (6)
- Semi-documented feature (10)
- Semi-documented function (35)
- Stock Matlab function (139)
- Toolbox (9)
- UI controls (52)
- Uncategorized (13)
- Undocumented feature (217)
- Undocumented function (37)
Tags
AppDesigner Callbacks COM Compiler Desktop Donn Shull Editor Figure FindJObj GUI GUIDE Handle graphics HG2 Hidden property HTML Icons Internal component Java JavaFrame JIDE JMI Listener Malcolm Lidierth MCOS Memory Menubar Mex Optical illusion Performance Profiler Pure Matlab schema schema.class schema.prop Semi-documented feature Semi-documented function Toolbar Toolstrip uicontrol uifigure UIInspect uitools Undocumented feature Undocumented function Undocumented propertyRecent Comments
- Antonio (12 days 10 hours ago): Note Intel’s MKL implementations of BLAS/LAPACK are already multi-threaded, so it is likely that you won’t achieve a vast improvement (the overall performance could even...
- Testing 123 (250 days 1 hour ago): The mexCallMATLAB function raises interesting possibilities for parallelization. I spent a few hours (days…) writing a mexFunction that mimics the functionality of...
- Andrés Aguilar (389 days 0 hours ago): Hello, has anyone tried to change the language of the DateComboBox? For example English -> French ————&# 8212;—- January -> Janvier April...
- Yair Altman (681 days 3 hours ago): You didn’t say what code you were trying to run and what exactly didn’t work for you, so I cannot help you. In general I can say that the code still works ok on...
- Nicholas (683 days 0 hours ago): It has come to my attention that in R2022a the content for HtmlText and CurrentLocation cannot be set for an HTMLBrowserPanel object. This can be easily demonstrated in R2022a with...
- bryan taylor (684 days 7 hours ago): I’m using matlab r2021a. The command above don’t seem to work. The commands run without error but the changes do no effect the text box.
- Yair Altman (701 days 8 hours ago): @Mitchell – in most cases the user wants a single string identifier for the computer, that uniquely identifies it with a distinct fingerprint that is different from any other...
- Mitchell (701 days 17 hours ago): Great post! I’m not very familiar with the network interfaces being referenced here, but it seems like the java-based cross-platform method concatenates all network...
- Eric (750 days 5 hours ago): this save me a lot of time, thank you very much!
- Yair Altman (1072 days 2 hours ago): You forgot to wait for the figure and the axes to fully render. After a pause and drawnow the code works ok (at least in R2021a).
- Anton Semechko (1072 days 2 hours ago): Hi, Yair, Do you know why is it impossible to add listeners to any of the uiobjects in UIFigure? And is there some way to work around this limitation? For example:...
- Davide Coluzzi (1107 days 1 hour ago): Hello, I have just found out this website and the book, they are great! Many thanks for this. I am developing a GUI in Matlab and I added a uiimage to receive info, so that...
- Yair Altman (1224 days 7 hours ago): drawnow is the entry function to Matlab graphics updates, which chains numerous internal drawing/painting calls, as well as associated callbacks (internal and user-defined)....
- Ondrej (1224 days 7 hours ago): Hi Yair, I have a slightly off-topic question. I am using Matlab 2017a and when using drawnow to refresh the graphics I noticed in the profiler (with -memory option on) this: Code...
- Florian (1455 days 15 hours ago): Hello Yair thank you for this work. I am trying to using the sorting function but obviously it treat my ‘double’ as ‘string’. Then the sorting of the numbers...
Contact Us
Bold color text in the Command Window
A reader comment last week sent me on a short wild goose chase, that had an interesting and useful conclusion. The comment requested a way to display bold text in the Command Window, similarly to the way that we can display colored and underlined text using my cprintf utility.
Since Matlab release 7.13 (R2011b), the Matlab Command Window (CW) has the ability to display bold text. This is used, for example, when displaying the function name in the output of the help function (i.e., help(‘max’) will display the term ‘max’ in bold when displaying the help section). It therefore seemed a reasonable request to add this functionality to cprintf.
Attempt #1: use the underlying Java
I stated out investigating the relevant attributes used by the CW’s underlying Java component to display the text. It turns out that in addition to the three custom attributes used by Matlab in past releases, a fourth attribute called BoldStartTokens was added, which stored the relative position index of the bold text within each text element.
Unfortunately, this attribute contains an array of integer values, that get converted to a simple numeric array in Matlab. This means that unlike the SyntaxTokens attribute, which contains an array of Java String objects that can be modified one at a time (this is used by cprintf), the BoldStartTokens attribute value cannot be modified in a similar manner. Attempting to remove and add the attribute afresh (with modified values) failed due to a javax.swing.text.StateInvariantError: Illegal cast to MutableAttributeSet Java exception.
So unless I find a way to update the BoldStartTokens attribute values from Matlab, this looked like a dead end.
Attempt #2: follow the Matlab trail
My second attempt was to follow the Matlab trail, to see exactly what the help function does internally to format parts of the text as bold. Starting with help‘s m-file (%matlabroot%/toolbox/matlab/helptools/help.m), and step-by-step debugging, I quickly found out that the internal function prepareHelpForDisplay parses the help text and wraps the relevant terms with an HTML <strong> tag to make these terms appear bold.
We can easily use this information ourselves:
>> fprintf('not bold, <strong> bold </strong>\n')
not bold, bold     % the 'bold' term appears bolded
Matlab does have an internal limitation, of not allowing hyperlinks and bold formatting together. If both <a> and <strong> tags are present, then only the inner tag set is parsed.
Updating cprintf
Using <strong> is great, but apparently if we use the <strong> tag in cprintf, the output gets messed up – the HTML tag confuses cprintf. So I took the opportunity to update cprintf such that (1) it will not get confused by a <strong> tag, and (2) so that we could use ‘*’ in the style part (input argument #1) to specify bold format:
>> cprintf('*blue', 'this is bold\n')
this is bold     % this text appears bolded-blue
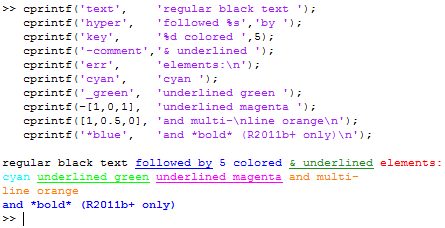
cprintf demo
Continue reading
Categories: Desktop, High risk of breaking in future versions, Java, Undocumented feature
Tags: Desktop, HTML, Java
3 Comments
Tags: Desktop, HTML, Java
3 Comments
xlswrite for Mac, Linux
Numerous Matlab users have expressed frustration over the years at the fact that the xlswrite function, used for saving/updating Excel files, is only supported on the Windows platform. Matlab uses Excel COM to implement xlswrite functionality, and since COM is a Windows-specific technology, xlswrite does not work on non-Windows platforms.
In such cases, Matlab users normally save the data into a CSV (comma-separated values) file, using the built-in csvwrite or dlmwrite functions, or File-Exchange utilities such as Any2CSV. This enables saving the data, but does not enable saving formatting information or graphic objects (e.g., plots or images). As a side note, xlswrite also does not allow saving formatting information or graphic objects, but at least on Windows we can use direct COM to add them (or use my OfficeDoc utility).
Java solutions for spreadsheet access
Luckily, the community of Java developers, which is an order of magnitude larger than the Matlab community, has developed several utilities that we can easily use in Matlab to implement xlswrite‘s functionality on Macs, Linux, and wherever else Matlab may run – even Windows, if we really wish. Most articles on this website that deal with Java focus on its GUI aspects, i.e., how to use Java to improve Matlab’s plain-vanilla appearance/behavior. But Java is in fact a very broad programming platform that has an enormous repository of non-GUI solutions: networking, database support, data structures, computational algorithms, etc. etc. – and a huge number of them are open-source. Unlike Java’s GUI goodies, these Java packages, being non-GUI in nature, are fully supported by Matlab.
The Excel spreadsheets support, and Office support in general, is just another example of the wide range of non-GUI packages available in Java. In fact there are full-fledged Office lookalikes written in Java (most notably the open-source OpenOffice). We can either use these applications directly, or interact with them from Matlab (via Java), just as we can interact with Excel on Windows.
There are several Java packages that enable reading and writing spreadsheet data, without the full-blown Office support. One such open source project is the ODF (Open Document Foundation) Toolkit, which has plenty of online resources. In 2010 a Matlab user contributed a utility to use the ODF Java package for reading and writing ODF-format spreadsheets (*.ods). Other users have also provided ODF utilities for Matlab.
Using ODF is excellent and cross-platform, but does not solve the Excel problem directly, because the ODF format is incompatible with the XLS format. We can use another open-source Java package, JExcelApi, for this. JExcelApi is relatively easy to use and has several online tutorials (example1, example2), although it is not as widely used as ODF.
Another open-source Java package that can be used to directly read and write XLS files is Apache POI. An informal comparison of POI and JExcelApi can be found here.
xlwrite
Very recently, Marin Deresco has posted a Matlab utility called xlwrite that uses JExcelApi for implementing an xlswrite variant that can be used on all Matlab platforms.
Continue reading
Categories: Java, Low risk of breaking in future versions
Tags: ActiveX, COM, Excel, File Exchange, Java
9 Comments
Tags: ActiveX, COM, Excel, File Exchange, Java
9 Comments
Splash window for deployed applications
One of the most annoying features of the Matlab compiler is the fact that compiled (deployed) applications take a loooooooooong time to load the first time that they are run on the target platform, or after a computer restart. This can take anywhere from 15-60 seconds, depending on platform characteristics. During this time, there is absolutely no visual indication that the application is loading. The application displays no window or other visual cue to let the user know something is loading.
I have seen many users double-click the application icon again and again in frustration, thinking that perhaps the application did not start when they first tried. In fact, this launches multiple applications and MCR loads at the same time, which only prolongs the overall time that it takes the application to actually load and display.
The “normal” solution for this would be to display a splash figure or start-up message at the very beginning of the application. Unfortunately, this doesn’t help because the vast majority of the launch time is due to MCR load time, which happens before any user code is executed. The result is that our application’s splash figure or msgbox will only be displayed after the very long time in which the application appears unresponsive.
Splash-window solution
 I developed a splash-screen wrapper application for deployed applications that solves this problem on Windows platforms.
The idea is to create a stand-alone non-Matlab application that displays a user-specified image (splash) in a dedicated window at the center of the screen, and then immediately launches the requested deployed Matlab application in the background. The wrapper then waits for the Matlab application to load, and automatically closes the splash window when it detects that the target Matlab GUI has finally displayed.
The effect is that upon launching the application, the user sees immediate feedback in the form of a dedicated splash window (for example, displaying an image of the application or company logo with the message “Loading – please wait…”). This does not make the target application load any faster, but at least users are given immediate feedback that prevents them from re-launching the application. Users also report that this makes the application appear to load faster. This is due to a psychological effect called “perceived performance” – we also see this effect with phone ringtones and elevator floor-level indicators.
My splash wrapper application receives the following input parameters:
- splash image filepath (BMP/JPG/GIF – note that other formats are NOT supported)
- splash image width in pixels (will resize the image if necessary)
- splash image height in pixels (will resize the image if necessary)
- target window title string
- title matching mode:
- 1 = match at the beginning of the title (case sensitive)
- 2 = match at any place within the title (case sensitive)
- 3 = match the entire title (case sensitive)
- -1, -2, -3 = case-insensitive version of the above values
- target application filepath (this is the actual deployed application executable)
- optional input parameters for the target application
Categories: GUI, Low risk of breaking in future versions
Tags: Compiler, GUI, Performance
Comments Off on Splash window for deployed applications
Tags: Compiler, GUI, Performance
Comments Off on Splash window for deployed applications
Waiting for asynchronous events
It often happens that we need our program to wait for some condition to occur. This condition may depend on some external process that updates the condition asynchronously, meaning in a non-predictable (non-specific) time. A typical example is user mouse or keyboard actions in a GUI dialog window, or a specific signal that is received from hardware.
waitfor and other built-in functions
Matlab has a couple of built-in functions for blocking Matlab’s main processing thread until certain asynchronous GUI events occurs. waitfor is documented to block code execution until either the specified GUI handle object is deleted, or is updated (possibly to a specified value), or Ctrl-C is pressed in matlab’s Command Window. uiwait similarly blocks execution, until a specified figure handle is deleted/closed, or a separate processing thread (typically, a callback function) calls the corresponding uiresume (I discussed uiwait/uiresume, together with their uisuspend/uirestore siblings, last year). uiwait, unlike waitfor, has an optional timeout parameter; on the other hand, uiwait cannot wait for a non-deletion event on a regular uicontrol property, as waitfor can.
Other related built-in Matlab functions are waitforbuttonpress, pause (which awaits user mouse/keyboard clicks), and ginput, gtext, rbbox, dragrect (which awaits mouse clicks in a plot/image axes). Some toolboxes have other similar blocking functions, for example roipoly in the Image Processing toolbox.
Waiting for events on non-HG objects
But what if we need to wait for an event to happen on a non-Matlab (HG) object? Say on an ActiveX control property or even on a non-graphical Java object?
It turns out that waitfor can also be used in these cases. Although not documented, waitfor actually accepts handles not only of HG objects (e.g., figure handles) but also of other types of handles, such as regular Java reference handles. The usage is the same as for regular HG handles:
waitfor(objectHandleOrReference, 'propertyName', propertyValue);
For example, to wait for data to be available in a java.util.Hashtable object, which has a public boolean isEmpty() method and therefore returns a value of ‘on’ or ‘off’ for get(object,’Empty’):
waitfor(javaHashTableReference, 'Empty', 'off');
Trapping warnings efficiently
A not-well-known performance improvement trick for catching errors is to place the entire code section within a try–catch block. This is more efficient than constantly checking for some condition. For example:
% Standard code
for loopIndex = 1 : N
   refIndex = someCalculation();
   if refIndex > 0
      A(loopIndex) = B(refIndex);
   else
      A(loopIndex) = loopIndex;
   end
end

% Faster code
for loopIndex = 1 : N
   refIndex = someCalculation();
   try
      A(loopIndex) = B(refIndex);
   catch
      A(loopIndex) = loopIndex;
   end
end
Trapping warnings
However, what should we do in case the checked condition is meant to prevent a warning (e.g., file-access warnings) rather than an error? It would make sense to use the same exception-handling trick, but unfortunately warnings do not normally raise a trappable exception. This question was asked on the CSSM newsgroup many years ago and received no answer, until Michael Wengler recently provided the undocumented solution on that thread:
It appears that in addition to the documented alternatives for the value of the warning function’s first parameter (namely ‘Message’,
For example:
% Set a couple of warnings to temporarily issue errors (exceptions)
s = warning('error', 'MATLAB:DELETE:Permission');
warning('error', 'MATLAB:DELETE:FileNotFound');

% Run the processing section
filesList = {'a.doc', 'b.doc', 'c.doc'};
for fileIndex = 1 : length(filesList)
   try
      % Regular processing part
      fileToDelete = filesList{fileIndex};
      delete(fileToDelete);
   catch
      % Exception-handling part
      fprintf('Can''t delete %s (reason: %s)\n', fileToDelete, lasterr);
   end
end

% Restore the warnings back to their previous (non-error) state
warning(s);
For the record, this warning(‘error’,…) trick appears to work in Matlab releases as far back as R14SP3 (2005), and possibly even earlier (I don’t have older releases readily available, so I couldn’t check). This looks like a pretty stable feature, as far as undocumented features go. Of course, it could well be taken out at any future Matlab release, but for the time being we can definitely make good use of it.
Trapping specific warning IDs
How can we know the specific warning IDs (e.g., ‘MATLAB:DELETE:FileNotFound’) to use? The answer is to call warning(‘on’,’verbose’) and then simulate the warning. For example:
>> warning on verbose

>> delete sadfsefgsdfg
Warning: File 'sadfsefgsdfg' not found.
(Type "warning off MATLAB:DELETE:FileNotFound" to suppress this warning.)
Within the exception-handling part, we could check the specific exception that was thrown and possibly act differently. For example:
try
   % Regular processing part
   fileToDelete = filesList{fileIndex};
   delete(fileToDelete);
catch
   % Exception-handling part
   err = lasterror;
   switch identifier
      case 'MATLAB:DELETE:Permission'
         fprintf('Can''t delete %s (reason: no permission)\n', fileToDelete);
      case 'MATLAB:DELETE:FileNotFound'
         fprintf('Can''t delete %s (reason: file not found)\n', fileToDelete);
      otherwise
         fprintf('Can''t delete %s (reason: %s)\n', fileToDelete, lasterr);
   end
end
Note that within the exception-handling part, I used the lasterr and lasterror functions, rather than lastwarn. The reason is that the warnings have been converted into standard errors, and are no longer even reported by lastwarn.
The acute reader will have noticed that I am using the older (deprecated) manner of exception handling, that does not directly pass the error struct into an identifier next to the catch keyword. The reason is that I usually intend my code to be backward compatible. Had I used the newer syntax, the code would not have worked on old Matlab releases; this way it does, subject to the availability of the above-mentioned undocumented warning(‘error’,…) trick. If you read through the code of my numerous submissions on the File Exchange, you will see that this is a recurring theme. I often use old deprecated syntax to ensure that my code will run on as many Matlab releases as possible.
Are you interested in learning more performance improvement methods? Then consider joining my Matlab Performance Tuning seminar/workshop in Geneva on August 21, 2012 – email me (altmany at gmail dot com) for details.
Using Groovy in Matlab
Once again I would like to welcome guest blogger Malcolm Lidierth of King’s College London, who has already written here in the past. Today Malcolm will explain the basics of using Groovy code within Matlab.
Readers of this blog are likely to be familiar with calling Java from within Matlab code and/or writing custom Java code for Matlab use. But, Java is only one of many programming languages that can use the Java Virtual Machine. Here, I’d like to draw Matlab-users’ attention to another: Groovy.
 Groovy is a superset of Java that compiles to Java byte-code and seamlessly integrates with existing Java code. So seamlessly, in fact, that you can mix-and-match Java and Groovy syntax in a single file or method. This means that you can call Groovy classes from Matlab just as though they were Java classes: Matlab will see no difference.
Most IDEs support Groovy and include the necessary files – IntelliJ seems particularly good for Groovy development. Groovy is also available separately at http://groovy.codehaus.org/Download. Use Groovy 1.8.6 or earlier, not the latest 2.0 version (* see below).
All that is needed to run Groovy in Matlab is to include its jar files on your Matlab javaclasspath, by using Matlab’s javaaddpath function to add to the dynamic classpath, or by adding the jar locations to the classpath.txt file (the static classpath, which is generally better).
To illustrate a few of its features, below is a rough-and-ready static method in Groovy to return a factorial:
package Examples
class StaticLib {
   static factorial(n){
      def fact=1.0
      for (def k=1; k< =n; k++)
         fact*=k
      return fact
   }
}
Java programmers will note there are no public keywords: in Groovy public is the default. Next the method declaration has no return type. Neither does the input n. In Groovy, typing is optional. This is exploited on the next line, where fact is declared using the def keyword. Groovy will determine its type at runtime much as Matlab does for variables. The same is true for the loop control variable k.
To run the code at the Matlab command prompt, use commands as you would for Java e.g:
>> import Examples.StaticLib
>> StaticLib.factorial(40)
>> StaticLib.factorial(int64(40))
>> StaticLib.factorial(java.math.BigInteger(40))
all produce:
ans =
815915283247897734345611269596115894272000000000.0
This is an exact, and correct, result because Groovy instantiated fact as a java.math.BigDecimal when it was initialized with a floating-point value. Note also, that Groovy’s dynamic typing meant only one method was needed– not one for every possible class of input. With Groovy, you need to write much less code. (Caution: running this code with very large n will work, but slowly, and potentially take up all available memory to store the result).
The small typing change below makes a substantial difference to the code’s operation:
package Examples
   class NewLib {
      def factorial = {n ->
      def fact = 1.0
      for (def k = 1; k < = n; k++)
         fact *= k
      return fact
   }
}
Here, factorial is a property, not a method, of the class and its contents are the code – in Groovy this is a closure (in Matlab it would be called an anonymous function).
Create an instance of the NewLib class in Matlab, call the get method on the factorial property and run the code in Matlab as follows:
>> myObj=Examples.NewLib();
>> func=myObj.getFactorial();
>> func.call(40)
ans =
815915283247897734345611269596115894272000000000.0
Using Groovy saved a lot of work: there was no need to write a no argument constructor or a getFactorial() method. Groovy did that automatically.
Here is another code snippet where Groovy’s dynamic typing makes it look much more like Matlab than Java:
for (obj in props) {
   switch (obj.key) {
      …
      case "Alpha":
      case "EdgeColor":
      case "LineColor":
      case "XData":
      case "YData":
      case "ZData":
      plot.("set" + obj.key)(props.(obj.key))
      break
      …
   }
}
props is a LinkedHashMap. We start by running through each of the entries in this map in a loop using:
for (obj in props)
Each entry is assigned to obj in turn. Again, we let Groovy determine the class of obj dynamically – it will be of class java.util.LinkedHashMap$Entry, but we do not need to worry about that detail.
For each entry we retrieve the key and use that as the variable for the switch block. In this case, the keys are all strings and, in Groovy, strings can be used in case statements (Java 7 would be needed for that if the code were written in Java; note that Java 7 is still not integrated in Matlab as of this date).
Within the switch block, the code invokes a setter on an object called plot. Rather than write separate lines for each possible property in the key list, one line is enough:
plot.("set" + obj.key)(props.(obj.key))
The key string is pre-pended with “set” and the corresponding method is invoked passing the value from the LinkedHashMap entry as input – so a particular iteration of the loop, this might equate for example to plot.setAlpha(0.5)
For a Matlab programmer who is put off from delving into Java because of the tedious boiler-plate code it requires, Groovy may be an attractive alternative. Groovy also has many powerful features for handling regular expressions, a set of builder classes (for example a thread-safe SwingBuilder class), writing domain specific languages and for meta-object programming including run-time injection of new methods. There is also a growing set of Groovy plugin modules.
Not all Java programmers like Groovy. The dynamic features inevitably create run-time overheads and mean that type-mismatches that would be detected at compile-time in Java may produce run-time exceptions with Groovy, but Groovy 2.0 addresses some of these issues by introducing new compiler annotations. My own use of it has been limited, partly because of these issues: I have used it to create a static library to link Matlab, R, SciLab etc to a graphics package written in Java. The dynamic features of Groovy have been useful there to reduce the work involved.
* Note: Groovy 2.0 was released 28.06.2012. Initial experiments suggest it does not work within Matlab, perhaps because of version clashes with jars on the Matlab static class path.
—————————-
Note: in 21-23 August 2012, I (Yair) will present advanced Matlab training courses in Geneva, Switzerland. The planned topics are:
- Aug 21 – Matlab performance tuning
- Aug 22 – Advanced Matlab GUI
- Aug 23 – Using Java in Matlab (inc. extra advanced GUI)
Anyone interested please email me (altmany at gmail dot com) for more details.
Categories: Guest bloggers, Java, Low risk of breaking in future versions
Tags: Groovy, Java, Malcolm Lidierth
8 Comments
Tags: Groovy, Java, Malcolm Lidierth
8 Comments
Multi-line uitable column headers
I often need to present data in tabular format in Matlab GUI, and this data often has relatively long column headers such as “Maximal draw/gain” or “Coefficient of elasticity”. When the table has many columns, these long column headers do not fit in the small space that is available:
uitable('data',magic(2),'ColumnName',{'Maximal draw/gain','Coefficient of elasticity'})

Default uitable behavior with long headers
Creating multi-line headers
It makes sense to split such long column headers into a multi-line string. In the new (R2008a+) uitable, this can easily be done by adding the | character wherever we wish the line to be split; in both the new and the old uitable, we can also use the built-in HTML support by adding a simple <br/>. The following code snippet demonstrates both of these alternatives:
uitable('data',magic(2), 'ColumnName',{'Maximal|draw/gain', '<html><center />Coefficient<br />of elasticity</html>'});

Multi-line uitable headers
Much more readable and useful, I think. Note that HTML code is left-aligned by default, so to center the header I added the <center> tag in the snippet.
If the text appears too crowded in the header cells, we can slightly reduce the header font, to make it appear more spaced-out. The following snippet illustrates this for the old uitable (available since Matlab 7.0 all the way until today), which can only use the HTML alternative since it does not support |:
headers = {'<html>Maximal<br />draw/gain</html>', ...
           '<html><center /><font size=-2>Coefficient<br />of elasticity</font></html>'};
uitable('v0','data',magic(2),'ColumnNames',headers);

Multi-line headers in the old uitable
Dynamic multi-line headers
While adding | or <br/> solves the problem for the majority of cases, it is sometimes difficult to know in advance where to place the line-split. This often happens when the column headers are dynamically generated by the program. If we omit the <br/> from our header strings, we get sub-optimal rendering: The new uitable simply hides all overflow terms, and the old uitable pushes them to the bottom:
headers = {'<html>Maximal draw/gain</html>', ...
           '<html><center /><font size=-2>Coefficient of elasticity</font></html>'};
uitable('v0','data',magic(2),'ColumnNames',headers);

Default dynamic HTML multi-line (old uitable)
I’ve tried numerous things, including CSS wrapping directives etc. None seem to work (I’ll be happy to hear a new idea that does work), except for the following weird-sounding trick: add a “<br/> ” at the end of the HTML header string. If the column is wide enough, then this will be disregarded; otherwise, it will automatically split the string nicely:
headers = {'<html>Maximal draw/gain<br /> </html>', ... '<html><center /><font size=-2>Coefficient of elasticity<br /> </font></html>'}; uitable('v0','data',magic(2),'ColumnNames',headers);

Nicely-behaved dynamic HTML multi-lines
Note: the part is important – the trick will NOT work without it!
Controlling the headers
HTML provides some degree of control over the table header row. Some additional aspects can be configured by accessing the underlying Java’s TableHeader sub-component. But here’s another trick that I found handy: I hide the table header row altogether, and use the top table data row for my headers. I can control this row’s height using JTable’s standard setRowHeight() method. Using some fancy cell background colors I can make this row stand out, and I can easily control other aspects as well.
The same trick can also be used for the row-header column: I can dispense with the standard one and use the table’s first column as a row-header column.
For more information on uitable customization, refer to section 4.1 of my Matlab-Java book, or to my uitable customization report.
Do you have a favorite trick with multi-line strings in Matlab GUI? If so, please share it in a comment below.
The Java import directive
A recent blog post on a site I came across showed me that some users who are using Java in Matlab take the unnecessary precaution of always using the fully-qualified class-name (FQCN) of the Java classes, and are not familiar with the import directive in Matlab. Today I’ll show how to use import to simplify Java usage in Matlab.
Basically, the import function enables Matlab users to declare that a specific class name belongs to a particular Java namespace, without having to specifically state the full namespace in each use. In this regard, Matlab’s import closely mimics Java’s import, and not surprisingly also has similar syntax:
% Alternative 1 - using explicit namespaces
jFrame = javax.swing.JFrame;
jDim = java.awt.Dimension(50,120);
jPanel.add(jButton, java.awt.GridBagConstraints(0, 0, 1, 1, 1.0, 1.0, ...
                    java.awt.GridBagConstraints.NORTHWEST, ...
                    java.awt.GridBagConstraints.NONE, ...
                    java.awt.Insets(6, 12, 6, 6), 1, 1));

% Alternative 2 - using import
import javax.swing.*
import java.awt.*
jFrame = JFrame;
jDim = Dimension(50,120);
jPanel.add(jButton, GridBagConstraints(0, 0, 1, 1, 1.0, 1.0, ...
                    GridBagConstraints.NORTHWEST, ...
                    GridBagConstraints.NONE, ...
                    Insets(6, 12, 6, 6), 1, 1));
Note how much cleaner Alternative #2 looks compared to Alternative #1. However, as with Java’s import, there is a tradeoff here: by removing the namespaces from the code, it could become confusing as to which namespace a particular object belongs. For example, by specifying java.awt.Insets, we immediately know that it’s an AWT insets object, rather than, say, a book’s insets. There is no clear-cut answer to this dilemma, and in fact there are many Java developers who prefer one way or the other. As in Java, the choice is yours to make also in Matlab.
Perhaps a good compromise, one which I often use, is to stay away from the import something.* format and directly specify the imported classes. In the example above, I would have written:
% Alternative 3 - using explicit import
import javax.swing.JFrame;
import java.awt.Dimension;
import java.awt.GridBagConstraints;
import java.awt.Insets;

jFrame = JFrame;
jDim = Dimension(50,120);
jPanel.add(jButton, GridBagConstraints(0, 0, 1, 1, 1.0, 1.0, ...
                    GridBagConstraints.NORTHWEST, ...
                    GridBagConstraints.NONE, ...
                    Insets(6, 12, 6, 6), 1, 1));
This alternative has the benefit that it is immediately clear that Insets belongs to the AWT package, without having to explicitly use the java.awt prefix everywhere. Obviously, if the list of imported classes becomes too large, we could always revert to the import java.awt.* format.
Interestingly, we can also use the functional form of import:
% Alternative #1
import java.lang.String;

% Alternative #2
import('java.lang.String');

% Alternative #3
classname = 'java.lang.String';
import(classname);
Using the third alternative format, that of dynamic import, enables us to decide in run-time(!) whether to use a class C from package PA or PB. This is a cool feature but must be used with care, since it could lead to very difficult-to-diagnose errors. For example, if the code later invokes a method that exists only in PA.C but not in PB.C. The correct way to do this would probably be to define a class hierarchy where PA.C and PB.C both inherit from the same superclass. But in some cases this is simply not feasible (for example, when you have 2 JARs from different vendors, which use the same classname) and dynamic importing can help.
It is possible to specify multiple input parameters to import in the same directive. However, note that Matlab 7.5 R2007b and older releases crash (at least on WinXP) when one of the imported parameters is any MathWorks-derived (com.mathworks...) package/class. This bug was fixed in Matlab 7.6 R2008a, but to support earlier releases simply separate such imports into different lines:
% This crashes Matlab 7.5 R2007b and earlier;  OK on Matlab 7.6 R2008a and later
import javax.swing.* com.mathworks.mwswing.*

% This is ok in all Matlab releases
import javax.swing.*
import com.mathworks.mwswing.*
import does NOT load the Java class into memory – it just declares its namespace for the JVM. This mechanism is sometimes called lazy loading (compare to the lazy copying mechanism that I described a couple of weeks ago). To force-load a class into memory, either use it directly (for example, by declaring an object of it, or by using one of its methods), or use a classloader to load it. The issue of JVM classloaders in Matlab is non-trivial (there are several non-identical alternatives), and will be covered in a future article.
A few additional notes:
- Although not strictly mandatory, it is good practice to place all the import directives at the top of the function, for visibility and code maintainability reasons
- There is no need to end the import declaration with a semicolon (;). It’s really a matter of style consistency. I usually omit it because I find that it is a bit intrusive when placed after a *
- import by itself, without any input arguments (class/package names) returns the current list of imported classes/packages
- Imported classes and packages can be un-imported using the clear import directive from the Command Window
- It has been reported that in some cases using import in deployed (compiled) application fails – the solution is to use the FQCN in such cases
Note: This topic is covered and extended in Chapter 1 of my Matlab-Java programming book
Categories: Java, Low risk of breaking in future versions, Memory
Tags: Java, Memory
Leave a comment
Tags: Java, Memory
Leave a comment
Undocumented scatter plot jitter
Yesterday I started presenting a multi-day Matlab training course for some client. As I was preparing the data visualization segment, I planned to show a programmatic implementation of scatterplot jitter when I came across an undocumented built-in implementation of exactly this mechanism, that I will describe today.
The problem with standard scatter plots
In a scatter plot, we cannot easily minor value differences, when the data points overlap each other. For example:
% Prepare the data
groupX = ones(1,100) * 30;
groupY = ones(1,100) * 24;
singletonsX = [20,40];
singletonsY = [18,32];
dataX = [groupX,singletonsX];
dataY = [groupY,singletonsY];

% Display in a scatterplot
scatter(dataX, dataY);
xlim([0,50]);
ylim([0,40]);
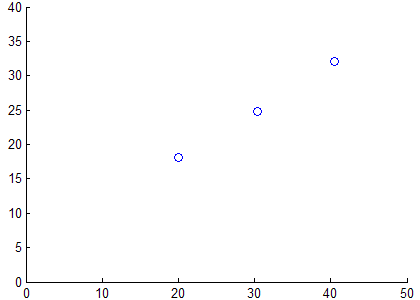
Standard scatter plot - cannot see distribution density
Both data points look exactly the same and no amount of zooming-in will discover that there are 100 data points in the center data point compared to only a single data point in the top-right and lower-left. When we wish to visually convey density distributions of real values this could lead to erroneous assumptions about the data.
The solution: jitter the data
The solution that is generally used in such cases is to either use some other plot type to convey the density information (e.g., histograms, CDF or quantile plots), or to keep using scatter plots but jitter the data just a tiny bit that would enable users to visualize the density more clearly. Jittering the data introduces minor inaccuracies to the data, which some may find anathema, but it does solve the visualization problem:
jitterAmount = 0.5;
jitterValuesX = 2*(rand(size(dataX))-0.5)*jitterAmount;   % +/-jitterAmount max
jitterValuesY = 2*(rand(size(dataY))-0.5)*jitterAmount;   % +/-jitterAmount max
scatter(dataX+jitterValuesX, dataY+jitterValuesY);
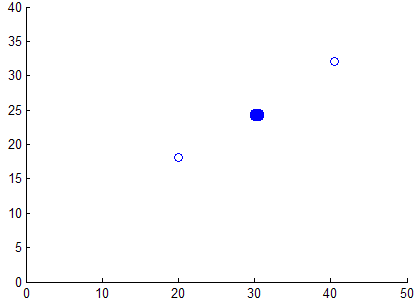
Scatter plot with Jittered data - distribution density evident
Much better, don’t you think?
Matlab’s built-in jitter
Interestingly, Matlab’s scatterplot has this mechanism built-in, using the undocumented hidden properties Jitter (default=’off’) and JitterAmount (default=0.2). Note that JitterAmount is an absolute (not relative) value, just as in my example above. Also, the built-in jitter only applies to the X data and does not jitter the Y values. Jitter is also applied only to 2D (not 3D) scatter plots:
scatter(dataX, dataY, 'jitter','on', 'jitterAmount',0.5);
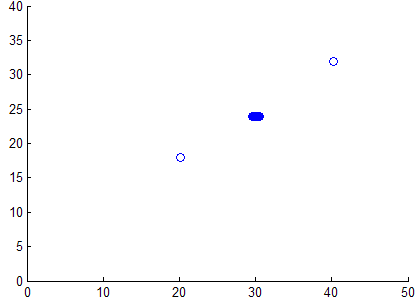
Scatter plot with Jittered X-data
This built-in Jitter functionality has existed all the way back to Matlab 7.1 (2005), and possibly earlier. I know it did not exist in Matlab 6.0; I am unsure regarding releases 6.5 and 7.0. In any case, as far as undocumented functionality goes, this one is pretty ancient.
Customizing Matlab’s jitter
The jitter implementation is provided in %matlabroot%/toolbox/matlab/specgraph/@specgraph/@scattergroup/refresh.m lines 16-18 (in R2012a):
if ~is3D && strcmp(this.Jitter,'on')
   x = x + (rand(size(x))-0.5)*(2*this.JitterAmount);
end
As you can see, it is trivially easy to modify this code to include Y-data jitter, or to make JitterAmount a relative rather than an absolute value. If you wish to use separate JitterAmounts for X and Y, change the definition of JitterAmount from ‘double’ to ”MATLAB array’ in %matlabroot%/toolbox/matlab/specgraph/@specgraph/@scattergroup/schema.m line 43:
hProp = schema.prop(hClass, 'Jitter', 'on/off');
hProp.Description = 'Enable/disable jittering';
hProp.FactoryValue = 'off';
hProp.Visible = 'off';
markDirtyProp = Lappend(markDirtyProp,hProp);

hProp = schema.prop(hClass, 'JitterAmount', 'double');    % Change this, 'double' => 'MATLAB Array'
hProp.Description = 'Maximum amount of jitter';
hProp.FactoryValue = .2;
hProp.Visible = 'off';
markDirtyProp = Lappend(markDirtyProp,hProp);
Other hidden properties of scatterplots
For the record, here is a list of the other hidden properties of scatterplot. This list can be retrieved using my getundoc utility:
>> hggroup = scatter(dataX, dataY);
>> getundoc(hggroup)
ans =
        ALimInclude: 'on'
    ApplicationData: [1x1 struct]
           Behavior: [1x1 struct]
        CLimInclude: 'on'
              Dirty: 'clean'
          EraseMode: 'normal'
       HelpTopicKey: ''
    IncludeRenderer: 'on'
        Initialized: 1
             Jitter: 'on'
       JitterAmount: 0.51
        PixelBounds: [0 0 0 0]
        RefreshMode: 'auto'
       Serializable: 'on'
        XLimInclude: 'on'
        YLimInclude: 'on'
        ZLimInclude: 'on'
Of these properties, the following are unique to scatter plots: Dirty, Initialized, Jitter, JitterAmount, RefreshMode. The rest are common to all Handle Graphic objects.
You may also be interested in the article I posted a few years ago about another undocumented scatterplot behavior.
