A few months ago I discussed various undocumented manners by which we can customize Matlab contour plots. A short while ago I receive an email from a blog reader (thanks Frank!) alerting me to another interesting way by which we can customize such plots, using the contour handle’s hidden ContourZLevel property. In today’s post I will explain how we can use this property and expand the discussion with some visualization interactivity.
The ContourZLevel property
The contour handle’s ContourZLevel property is a hidden property. This means that, just like all other hidden properties, it is accessible if we just happen to know its name (which is easy using my getundoc utility). This property sets the Z level at which the contour lines are drawn.
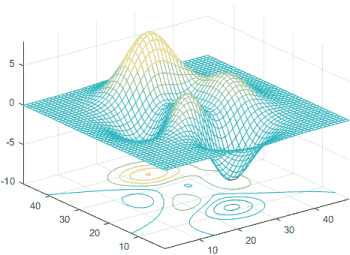
For example, by default the meshc function sets ContourZLevel‘s value to the bottom of the 3D display (in other words, to the axes’ ZLim(1) value). This is done within the mesh.m function:

Standard Matlab meshc output (contour at bottom)
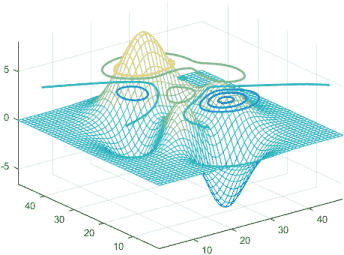
We can, however, modify the contour’s level value to any other Z location:
% create a mesh and contour plot
handles = meshc(peaks);

% handles is a 2-element array of handles: the surface plot and the contours
hContour = handles(2); % get the handle to the contour lines
hContour.ContourZLevel = 4.5; % set the contour's Z position (default: hAxes.ZLim(1)=-10)

% We can also customize other aspects of the contour lines, for example:
hContour.LineWidth = 2; % set the contour lines' width (default: 0.5)

Customized Matlab meshc output
Adding some visualization interactivity
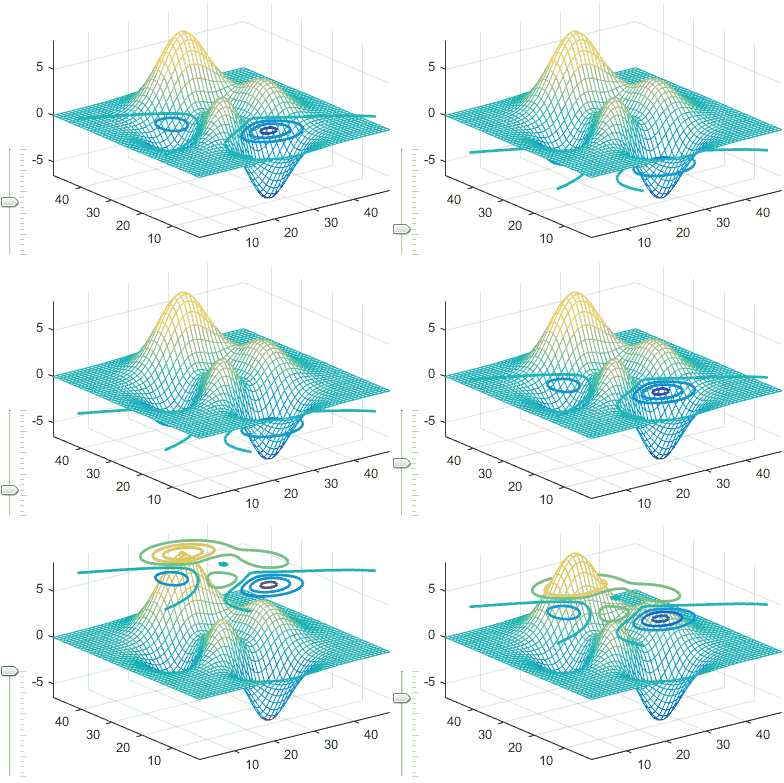
Now let’s add some fun interactivity using a vertical slider to control the contour’s height (Z level). Matlab’s slider uicontrol is really just an ugly scrollbar, so we’ll use a Java JSlider instead:
% Add a controlling slider to the figure
jSlider = javaObjectEDT(javax.swing.JSlider);
jSlider.setOrientation(jSlider.VERTICAL);
jSlider.setPaintTicks(true);
jSlider.setMajorTickSpacing(20);
jSlider.setMinorTickSpacing(5);
jSlider.setBackground(java.awt.Color.white);
[hjSlider, hContainer] = javacomponent(jSlider, [10,10,30,120], gcf);

% Set the slider's action callback
hAxes = hContour.Parent;  % handle to containing axes
zmin = hAxes.ZLim(1);
zmax = hAxes.ZLim(2);
zrange = zmax - zmin;
cbFunc = @(hSlider,evtData) set(hContour,'ContourZLevel',hSlider.getValue/100*zrange+zmin);
hjSlider.StateChangedCallback = cbFunc;  % set the callback for slider action events
cbFunc(hjSlider,[]);  % evaluate the callback to synchronize the initial display

Interactive contour height


 One thing with the modified code is that it is necessary to add an attachment to send an...
Hello,
Why do I get an error
“??? Reference to non-existent field ‘Parent’.” hCountour is defined in the first code part you gave.
I simply copy and past two fields.
@Kerem – you did not copy properly. It is
hContour, nothCountour. As to why the Parent field does not exist, perhaps you are using an old Matlab version (HG1, R2014a or older).I displace the contour plane using the documented feature hgtransform.
Hello. Thanks for this.
I’m looking for a way to add this scroll bar but using Level as action. I want to mess around with the cutting level of a contour plot interactively.
Thanks for any help.
@Ricardo – I don’t quite understand what you need. In general, if you want to change the action of the slider then simply update its callback function:
Hello,
I use “surf” with x and y as vectors, and z as matrix. I want to move the contours at 59.7 in z, so I wrote this:
I don’t see the contours, instead I see a small “bar” along z axis.
May you please give me a hint?
Thanks in advance.