Every now and then, I stumble on a Matlab feature that looks interesting and potentially useful and has existed for many previous Matlab releases, yet remains undocumented and unsupported. Today I present one such object, Matlab’s graphics.cursorbar.
The graphics.cursorbar object answers a very basic need that is often encountered in graph exploration: displaying data values together with horizontal/vertical cross-hairs, similarly to ginput.
While Matlab has provided the data-cursor mode for a long time, the cross-hair feature is still missing as of R2010b. Many CSSM newsgroup readers have asked about this missing feature. Some recent examples: here, here, and here.
DataMatrix
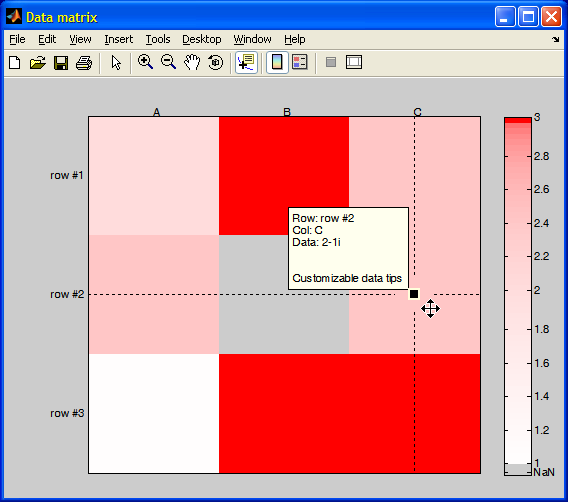
To answer this need I have created the DataMatrix utility, which is available on the Matlab File Exchange:

DataMatrix: customizable data tooltip & cross-hairs
DataMatrix displays matlab’s standard data-cursor tooltip together with dotted cross-hairs, both of which move with the mouse pointer. DataMatrix is actually based mostly on fully-documented stuff: the undocumented aspects are secondary to the main program flow and mostly just ensure old releases compatibility and correct behavior in the presence of some figure modes.
graphics.cursorbar
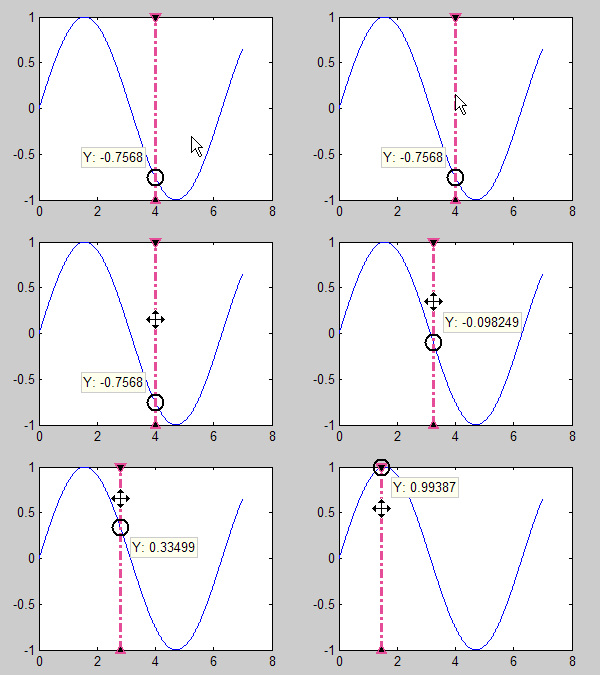
When I created DataMatrix in 2007, I had no idea that graphics.cursorbar already existed. graphics.cursorbar is an internal Matlab object, that is undocumented and unsupported. It has several advantages over DataMatrix, being more customizable in the cross-hairs and data marker, although not enabling to customize the tooltip text nor to present both cross-hairs (only horizontal/vertical, not both). It is one of the earliest examples of Matlab’s old class system (schema-based).
We initialize a graphics.cursorbar object by supplying an axes (not very useful) or plot-line handle (more useful). The cursorbar handle can be customized using properties such as BottomMarker, TopMarker, CursorLineColor, CursorLineStyle, CursorLineWidth, TargetMarkerSize, TargetMarkerStyle, ShowText, Orientation, Position (Position is a hidden property) etc., as well as the regular HG properties (UserData, Visibility, Parent etc.).
Once the cursor-bar is created, it can be dragged and moved via the mouse cursor, as the following code snippet and animated gif show:
t=0:.01:7; hp=plot(t,sin(t));
hCursorbar = graphics.cursorbar(hp); drawnow
hCursorbar.CursorLineColor = [.9,.3,.6]; % default=[0,0,0]='k'
hCursorbar.CursorLineStyle = '-.';       % default='-'
hCursorbar.CursorLineWidth = 2.5;        % default=1
hCursorbar.Orientation = 'vertical';     % =default
hCursorbar.TargetMarkerSize = 12;        % default=8
hCursorbar.TargetMarkerStyle = 'o';      % default='s' (square)

Matlab's internal cursorbar object
Comments within the internal code (%matlabroot%\toolbox\matlab\graphics\@graphics\@cursorbar\*.m) suggest that graphics.cursorbar has been around since 2003 at least, although I have not checked such old releases. The presented tooltip resembles one of the old data tips, not one of the modern ones. In addition, as far as I can tell, graphics.cursorbar is not used within the Matlab code corpus. For these reasons it would not surprise me at all to find that MathWorks will remove this feature in some near future release. Until then – have fun using it!
Can you find a good use for graphics.cursorbar? if so, please let us know by posting a comment below.
Note: graphics.cursorbar was removed in Matlab release R2014b (8.4), as part of the transition to the new graphics system (HG2). Perhaps one day a replacement functionality will be added. Until then, we can use Michelle Hirsch’s dualcursor utility, or Yaroslav Don’s direct replacement cursorbar (see comment below), which apparently has the official approval of MathWorks and was selected as File Exchange Pick of the Week.


 One thing with the modified code is that it is necessary to add an attachment to send an...
Thanks a lot for the helpful tutorial on the cursorbar. I’m wondering how I could set the displayed text such as the “y: -0.7568” in this example. Can I also display the x-coordinate?
@Yunde – you can change the graphics.cursorbar object’s UpdateFcn property to a custom text-update function handle, as described here.
Also see this related article: https://undocumentedmatlab.com/blog/controlling-plot-data-tips/
Really more useful. But for the spectral analysis, it will be fantastic to have two horizontal (dual) graphics.cursorbar at the same time in the same plot with displaying (x,y) values for each one
@Fantassi – you can easily create multiple graphics.cursorbar objects by simply repeating the creation command and assigning two separate handles:
Hello Mr Altmann.
Thank you very much for your reply.
In the spite of the fact that I’m just a very slowly starter with matlab, I know that. That I’m looking for, is to obtain 2 vertical cursorbars that displays x-values or (x,y)-values not only y-values, and additionnaly 2 horizontal cursorbars that displays y-values or (x,y)-values not only x-values.
Thank you again
@Fatnassi – see my answer above to @Yunde. For horizontal cursorbars use the Orientation property. If you still need my help in customizing your application, please contact me via email (see the link at the top-right of this webpage) – I would be happy to help you for a compensation of my time and expertise.
Yair,
Thanks, this is incredibly helpful. Is there a way to link multiple cursorbars, on the same axes object or a different axes object, so that when you move one cursor bar, the linked ones follow the same movement?
If not, is there a way to programmatically move the position of the cursorbar so after one moves, you would be able to move others to the same x axis location (for a vertical orientation)?
Thanks!
@JP – use the linkprop function
Thank you! extremely useful information. I’ve been using this script but I’m having some troubles customizing the marker color. For some reason, the edit plot feature shows that the cursorbar has a TargetMarkerFaceColor and a TargetMarkerEdgeColor option, but it seems they are not working for me and I can’t change the marker color… any suggestion?
@reivajtux – You are correct, it is due to an internal Matlab bug. Here is the workaround, based on the cursorbar’s hidden property TargetMarkerHandle:
You can also use TargetMarkerHandle to update other aspects of the target marker, such as LineStyle, LineWidth, LineSmoothing, or Visible.
I’ve been playing around with the cursorbar today and it is surprisingly functional. I have spectra plots with multiple axis and plots on each axis. This does work very well for multiple line series on a given axis, you just have to use an array of line series handles to create the cursorbar. It will then show the y-values for each plot, pretty neat.
It doesn’t really seem to work across multiple axes, it does show all the values, but the y-value lables are postioned to the primary y-axis only. But there may be some way to cheat with the input data so it does work.
@J
This might be of some help across multiple axes.
Very cool…is there any way to link this to multiple figures? i.e. if I move the cursorbar in one figure..it will update it in another. Also kind seperate…is there a way to tile figures using a script. I can do it manually by using the “Tile” button in the upper right hand corner of the figure window. Was hoping to do this with a script. Very cool site…looking forward to reading the book
@Jinu – you could probably use handle listeners to link the cursor-bar to another figure.
Thanks for sharing Yair, this seems to be quite useful.
I am implementing this in a GUI to allow the user to graphically select a value on the y-axis of a data plot. I basically invoke the cursorbar in a callback of a pushbutton and several cursorbars can be added to the plot. I am using it instead of ginput, because the plot is located in an axes environment (where i can’t change the pointer property), and it is very neat that you can use purely horizontal or vertical bars which have the exact extension of the axes.
I just have a small problem, maybe somebody can help me out. When adding a second, third.. cursorbar: The cursorbar is always drawn at the location of the CurrentPoint value of the axes, which is usually the exact place where already the previous cursorbar is parked. I prefer to have them occur at a different position, but if i give a position as input argument it will be overwritten by the CurrentPoint value. Does somebody have an idea how to handle this?
found a rather simple solution to my problem… i can just reset the ‘CurrentPoint’ of the parent figure each time before adding a cursorbar.
Anyways, now it works quite nicely.. so once again: Great tool, thanks!
Hello Yair Altman,
Thank you for the great solution (I have been looking for this from the past few weeks. Finally…)
I have a couple of questions:
1. I did update (as you explained in one of your comments) the position of the cursorbar using the update function and display in the text box (as in the animated gif) is not changing the position when i move the cursorbar as expected.
2. Is there a possibility even to show the position of ‘X’ data in the small text
By the way an excellent website
@Nikhil – I don’t have an immediate answer but I’m pretty sure that it can be done by either modifying the Matlab code or using some hooks from the graphics.cursorbar object (
hCursorbar). Don’t be lazy, dig in to discover it yourself – this makes it much more fun. Then come back here and report what you found.Hello Yair Altman,
Thank you for the support & suggestion. It’s really fun searching for the solutions from the hooks you suggested. I found the solution by including the code:
in the UpdateFcn property callback.
pos is the current position of the cursorbar
StringText: pos(1:2)
It’s described in defaultUpdateFcn.
Hello Yair Altman,
Thanks for sharing.
I am currently trying to use the cursorbar on a spectrogram figure (with the spectrogram function) but I keep getting the following error : “Target must be a single axes handle, or an array of line handles”.
I guess it is because the spectrogram plot is in 3D, but I cannot find any solution (I’m a beginner in matlab).
If you have any idea, I would be very grateful.
Thanks in advance.
Best
-Nicolas-
@Nicolas – I don’t currently have the Signal Processing Toolbox, so I’m afraid I can’t help you with this, you’ll need to debug it by yourself…
Ok, I’ll try to find a solution.
Just for you to know, I also tried to display the cursorbar on a spectrogram drawn with the PlotSpectrogram function, and I get exactly the same error.
Dear Yair,
Is there a way to also get the Y value when using the horizontal mode?
Thanks
-nicolas-
See Nikhil above
Dear Yair,
I tried to link two cursorbars with the linkprop-function (as you suggested before) via the (hidden) ‘Position’-Property. As the ‘Position’ contains the x- as well as the y-Position some malfunctions occur (both cursorbars have the same x AND y-Positions) and the textbox of one of the bars doesn’t update anymore. I guess just the x-Positions should be linked. Is there a way to do so / what am I doing wrong?
Thanks in advance
Christoph
You cannot link only part of a property value. Instead, try using a property listener to set a custom callback function, that will update only the relevant part.
I failed to follow your advice – I really tried. Let’s say we have this:
How could I get one (or two superposed) cursorbar(s) into this figure showing the datapoints of both lines. Your help would be great here. Thank You
@Christoph – you can modify the code of graphics.cursorbar (%matlabroot%/toolbox/matlab/graphics/@graphics/@cursorbar/cursorbar.m) to add support for plotyy. It shouldn’t be too difficult – the source code only has ~430 lines of code and plenty of comments.
Hi Yair,
thank you for your suggestions. I do not have write permissions for these files and cannot edit them. Do you have any other idea, how to solve my problem?
Furthermore is it possible to synchronize two cursorbars within different subplots?
Christoph
You can place a modified copy of the file(s) in your own user path, where it takes precedence over the built-in path. To synchronize different cursorbars, you can use the linkprop function.
Hi Yair,
nevermind – I finally did it.
As I mentioned before, linkprop does not show the desired behaviour.
I added a listener via “handle.listener” function on the position property to call the update-function for all involved cursorbar handles and it works fine. A bit slow in case of many cursorbars but it is OK.
So there was no need to copy or edit any matlab-files.
Thank you
Christoph
Hello Yair, i’ve been using this feature for a while now, thanks again for pointing it out.
I think this feature has eventually been removed with the 2014b release (At least i can not find it anymore). Do you know anything that is on par, as a replacement?
@Dan – try Michelle Hirsch’s dualcursor utility. She’s the Matlab product manager at MathWorks, by the way.
Thanks, I will check it out!
@Yair,
I have also encountered the same issue as @Dan — Being a very useful feature, some of my files rely heavily on
graphics.cursorbar. Unfortunately, after TMW had decided to remove it, my programs ceased to work at all. Therefore, I needed a fast, reliable and indistinguishable solution (the last requirement is important: I didn’t want to modify large chunks of code).Simiarly to @Dan, I also couldn’t find an adequate solution; thus, I decided to take the mission on myself. Taking all the old files in
+graphics/@cursorbar, I modified them so that they work with HG2. Mainly, I mergedschemaandcursorbarto a single file built in Matlab’s new class system, and made a few minor changes to all other files. Since it is basically the same ol’ code, it works like a charm; almost no changes were required to my programs, and I feel it is even faster than the oldcursorbar.Now I have a dilemma: I want to publish my solution on the File Exchange, but most of the code and the entire logical structure is still TMW’s. Since I wish to avoid plagiarism and copyright issues, it creates quite a nuisance. How do you suggest to proceed?
With a gigantic thanks to Yaroslav, we now have an updated for R2014b version of cursorbar posted on the File Exchange: cursorbar. I believe it’s a straight drop-in replacement that should support code written against the undocumented cursorbar from previous releases.
Hi,
Thanks for sharing,
How can I change default position of cursuor? I need to 2 cursor bars and I want to see them seperately,
thanks
Use the
Locationor thePositionproperties. For example,Yair,
I was trolling around on this section a few weeks ago and I thought I saw a link to the File Exchange for a function that plotted multiple cursor bars on a Magnitude/Power Spectrum that indicated a fundamental plus several harmonics. I cannot find this link anymore. Do you recall where this link might be or what the name of the function might be?