R2014b brought a refreshing new graphics engine and appearance, internally called HG2 (the official marketing name is long and impossible to remember, and certainly not as catchy). I’ve already posted a series of articles about HG2. Today I wish to discuss an undocumented aspect of HG2 that I’ve encountered several times over the past months, and most recently today. The problem is that while in the previous HG1 system (R2014a and earlier) we could add property-change listener callbacks to practically any graphics object, this is no longer true for HG2. Many graphics properties, that are calculated on-the-fly based on other property values, cannot be listened-to, and so we cannot attach callbacks that trigger when their values change.
Property-change listeners in HG1
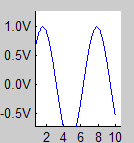
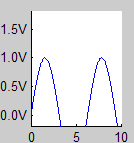
Take for example my post about setting axes tick labels format from 3 years ago: the idea there was to attach a Matlab callback function to the PropertyPostSet event of the XTick, YTick and/or ZTick properties, so that when they change their values (upon zoom/pan/resize), the corresponding tick-labels would be reformatted based on the user-specified format:


Formatted labels, automatically updated
A simple HG1 usage might look as follows:
addlistener(handle(hAxes), 'YTick', 'PostSet', @reformatTickLabels);

function reformatTickLabels(hProperty, eventData)
    try
        hAxes = eventData.AffectedObject;
    catch
        hAxes = ancestor(eventData.Source,'Axes');
    end
    tickValues = get(hAxes, 'YTick');
    tickLabels = arrayfun(@(x)(sprintf('%.1fV',x)), tickValues, 'UniformOutput',false);
    set(hAxes, 'YTickLabel', tickLabels)
end
I prepared a utility called ticklabelformat that automates much of the set-up above. Feel free to download this utility from the Matlab File Exchange. Its usage syntax is as follows:
ticklabelformat(gca,'y','%.6g V')  % sets y axis on current axes to display 6 significant digits
ticklabelformat(gca,'xy','%.2f')   % sets x & y axes on current axes to display 2 decimal digits
ticklabelformat(gca,'z',@myCbFcn)  % sets a function to update the Z tick labels on current axes
ticklabelformat(gca,'z',{@myCbFcn,extraData})  % sets an update function as above, with extra data
Property-change listeners in HG2
Unfortunately, this fails in HG2 when trying to listen to automatically-recalculated (non-Observable) properties such as the Position or axes Tick properties. We can only listen to non-calculated (Observable) properties such as Tag or YLim. Readers might think that this answers the need, since the ticks change when the axes limits change. This is true, but does not cover all cases. For example, when we resize/maximize the figure, Matlab may decide to modify the displayed ticks, although the axes limits remain unchanged.
So we need to have a way to monitor changes even in auto-calculated properties. Luckily this can be done by listening to a set of new undocumented HG2 events. It turns out that HG2’s axes (matlab.graphics.axis.Axes objects) have no less than 17 declared events, and 14 of them are hidden in R2015a:
>> events(gca)   % list the non-hidden axes events
Events for class matlab.graphics.axis.Axes:
    ObjectBeingDestroyed
    PropertyAdded
    PropertyRemoved

>> mc = metaclass(gca)
mc =
  GraphicsMetaClass with properties:
                     Name: 'matlab.graphics.axis.Axes'
              Description: 'TODO: Fill in Description'
      DetailedDescription: ''
                   Hidden: 0
                   Sealed: 1
                 Abstract: 0
              Enumeration: 0
          ConstructOnLoad: 1
         HandleCompatible: 1
          InferiorClasses: {0x1 cell}
        ContainingPackage: [1x1 meta.package]
             PropertyList: [414x1 meta.property]
               MethodList: [79x1 meta.method]
                EventList: [17x1 meta.event]    EnumerationMemberList: [0x1 meta.EnumeratedValue]
           SuperclassList: [7x1 meta.class]

>> mc.EventList(10)
ans =
  event with properties:
                   Name: 'MarkedClean'
            Description: 'description'
    DetailedDescription: 'detailed description'
                 Hidden: 1
           NotifyAccess: 'public'
           ListenAccess: 'public'
          DefiningClass: [1x1 matlab.graphics.internal.GraphicsMetaClass]

>> [{mc.EventList.Name}; ...
    {mc.EventList.ListenAccess}; ...
    arrayfun(@mat2str, [mc.EventList.Hidden], 'Uniform',false)]'
ans =
    'LocationChanged'             'public'       'true'
    'SizeChanged'                 'public'       'true'
    'ClaReset'                    'public'       'true'
    'ClaPreReset'                 'public'       'true'
    'Cla'                         'public'       'true'
    'ObjectBeingDestroyed'        'public'       'false'  % not hidden
    'Hit'                         'public'       'true'
    'LegendableObjectsUpdated'    'public'       'true'
    'MarkedDirty'                 'public'       'true'
    'MarkedClean'                 'public'       'true'
    'PreUpdate'                   'protected'    'true'
    'PostUpdate'                  'protected'    'true'
    'Error'                       'public'       'true'
    'Reparent'                    'public'       'true'
    'Reset'                       'public'       'true'
    'PropertyAdded'               'public'       'false'  % not hidden
    'PropertyRemoved'             'public'       'false'  % not hidden
Similar hidden events exist for all HG2 graphics objects. The MarkedDirty and MarkedClean events are available for practically all graphic objects. We can listen to them (luckily, their ListenAccess meta-property is defined as ‘public’) to get a notification whenever the corresponding object (axes, or any other graphics component such as a plot-line or axes ruler etc.) is being redrawn. We can then refresh our own properties. It makes sense to attach such callbacks to MarkedClean rather than MarkedDirty, because the property values are naturally stabled and reliable only after MarkedClean. In some specific cases, we might wish to listen to one of the other events, which luckily have meaningful names.
For example, in my ticklabelformat utility I’ve implemented the following code (simplified here for readability – download the utility to see the actual code), which listens to the MarkedClean event on the axes’ YRuler property:
try
    % HG1 (R2014a or older)
    hAx = handle(hAxes);
    hProp = findprop(hAx, 'YTick');
    hListener = handle.listener(hAx, hProp, 'PropertyPostSet', @reformatTickLabels);
    setappdata(hAxes, 'YTickListener', hListener);  % must be persisted in order to remain in effect
catch
    % HG2 (R2014b or newer)
    addlistener(hAx, 'YTick', 'PostSet', @reformatTickLabels);

    % *Tick properties don't trigger PostSet events when updated automatically in R2014b
    %addlistener(hAx, 'YLim', 'PostSet', @reformatTickLabels);  % this solution does not cover all use-cases
    addlistener(hAx.YRuler, 'MarkedClean', @reformatTickLabels);
end

% Adjust tick labels now
reformatTickLabels(hAxes);
In some cases, the triggered event might pass some useful information in the eventData object that is passed to the callback function as the second input parameter. This data may be different for different events, and is also highly susceptible to changes across Matlab releases, so use with care. I believe that the event names themselves (MarkedClean etc.) are less susceptible to change across Matlab releases, but they might.
Performance aspects
The MarkedClean event is triggered numerous times, from obvious triggers such as calling drawnow to less-obvious triggers such as resizing the figure or modifying a plot-line’s properties. We therefore need to be very careful that our callback function is (1) non-reentrant, (2) is not active too often (e.g., more than 5 times per sec), (3) does not modify properties unnecessarily, and in general (4) executes as fast as possible. For example:
function reformatTickLabels(hProperty, eventData)
    persistent inCallback
    if ~isempty(inCallback),  return;  end
    inCallback = 1;  % prevent callback re-entry (not 100% fool-proof)

    % Update labels only every 0.2 secs or more
    persistent lastTime
    try
        tnow = datenummx(clock);  % fast
    catch
        tnow = now;  % slower
    end
    ONE_SEC = 1/24/60/60;
    if ~isempty(lastTime) && tnow - lastTime < 0.2*ONE_SEC
        inCallback = [];  % re-enable callback
        return;
    end
    lastTime = tnow;

    % This is the main callback logic
    try
        hAxes = eventData.AffectedObject;
    catch
        hAxes = ancestor(eventData.Source,'Axes');
    end
    prevTickValues = getappdata(hAxes, 'YTick');
    tickValues = get(hAxes, 'YTick');
    if ~isequal(prevTickValues, tickValues)
        tickLabels = arrayfun(@(x)(sprintf('%.1fV',x)), tickValues, 'UniformOutput',false);
        set(hAxes, 'YTickLabel', tickLabels)
    end

    inCallback = [];  % re-enable callback
end
Unfortunately, it seems that retrieving some property values (such as the axes’s YTick values) may by itself trigger the MarkedClean event for some reason that eludes my understanding (why should merely getting the existing values modify the graphics in any way?). Adding callback re-entrancy checks as above might alleviate the pain of such recursive callback invocations.
A related performance aspect is that it could be better to listen to a sub-component’s MarkedClean than to the parent axes’ MarkedClean, which might be triggered more often, for changes that are entirely unrelated to the sub-component that we wish to monitor. For example, if we only monitor YRuler, then it makes no sense to listen to the parent axes’ MarkedClean event that might trigger due to a change in the XRuler.
In some cases, it may be better to listen to specific events rather than the all-encompassing MarkedClean. For example, if we are only concerned about changes to the Position property, we should listen to the LocationChanged and/or SizeChanged events (more details).
Additional graphics-related performance tips can be found in my Accelerating MATLAB Performance book.
Have you used MarkedClean or some other undocumented HG2 event in your code for some nice effect? If so, please share your experience in a comment below.


 One thing with the modified code is that it is necessary to add an attachment to send an...
The HG2 axes events became hidden in version R2015a. In my R2014b they are visible:
>> events(gca)
Events for class matlab.graphics.axis.Axes:
    LocationChanged
    SizeChanged
    ClaReset
    ClaPreReset
    Cla
    ObjectBeingDestroyed
    Hit
    LegendableObjectsUpdated
    MarkedDirty
    MarkedClean
    Error
    Reparent
    Reset
    PropertyAdded
    PropertyRemoved
I recall making use of the
Hitevent on several occasions. IMHO, it is the most useful event in the list. Can’t see why TMW decided to hide it in the latest release.The only hidden events in R2014b are
PreUpdateandPostUpdate, which have a protectedObservablevalue:@Yaroslav – thanks. It would be useful to hear how and why you’ve used the
Hitevent.@Yair — let’s examine a minimal working example:
It plots a point on the axes each time it is hit. One could argue that the
ButtonDownFcnproperty does the same thing. Yet, upon closer inspection, under the hoodButtonDownFcnusesHitto operate:<Clicks on the axes>
If one needs only a single callback, I guess that
ButtonDownFcnwill suffice. If there is a necessity for more than one,Hitis invaluable.Hey thanks, i will use ‘Hit’!
Hello Yair,
You contributed to this discussion https://www.mathworks.com/matlabcentral/newsreader/view_thread/283529 on how to change event listening of such toolbar objects as zoom or pan. The solution consisted in using
FYI it appears however that in R2014b modifying WindowListenerHandles is not possible: its SetAccess property is set to protected. Additionally, the former property Enable, a string ( ‘on’ | ‘off’ ), is now called Enabled and has become a scalar ( 0|1 ). Try:
Thanks, Vlad
@Vlad – that post is 5 years old and used undocumented/unsupported functionality. What’s surprising is not that it finally broke in R2014b, but that it kept working for so long. You can’t expect undocumented/unsupported functionality to keep working forever.
Specifically, R2014b broke quite a lot of undocumented features in its change of the graphics system (HG2). In most cases, things that broke have similarly-undocumented (or documented) equivalents in HG2, you just need to dig around a bit to discover them. The hard part was discovering the initial undocumented features in HG1; finding their equivalents in HG2 should be much easier.
Good luck!
While it seems like you can prevent re-entry with
since MATLAB timers run asynchronously and can execute between any two lines of code, if a timer callback occurs between the check and setting of inCallback, then you can get re-entry if the timer callback either calls reformatTickLabels or flushes the event queue and reformatTickLabels is in the event queue. I think to be safe you would need to do the check and setting of inCallback atomically, possibly with a mex file.
@Daniel – I agree that an atomic (mutexed) test-and-set function would be better, although in practice the probability of reentrancy with the above code is low. If you create such a MEX-based function and post it on the Matlab File Exchange , I’ll be happy to reference it in this blog.
I’ve been trying to find a way to prevent our users from deleting axes when they are deleting annotations. (This happens way more than I expected, and it is a major source of frustration). I thought it’d be easy to find an event or callback to hook into and pop up a dialog, but it’s proven fairly difficult for me to crack.
I thought maybe I could set a listener for ObjectBeingDestroyed, but it fires after the object is gone (or there’s a synch issue).
Is there some kind of ObjectAboutToBeDestroyed or DestroyObjectRequest thats double-secret-undocumented?
Any thoughts as to how I can hook into this behavior (or as a welcomed alternative, turn off the ability to delete axes with the keyboard – I mean seriously, why is that even a thing?)
@Nick –
You are my hero – thank you for this invaluable resource. And thank you for pointing me to an (embarrassed) *documented* feature.
Cheers!
I just learned a fun fact: plotting to an axes object who’s HitTest property is set to ‘off’ appears to reset HitTest to ‘on’
@Nick – this is a “known” undocumented side-effect of using the high-level plotting functions (such as plot), which reset several axes properties including HitTest and Tag. In contrast, the low-level plotting functions (such as line) do not reset these properties.
Yair – It looks like setting the Axes ‘NextPlot’ property to ‘add’ may prevent the resetting of HitTest. There is more behavior to investigate, but at least I seem to be on some kind of path. Thank you again