I was about to write on something completely different today, when I discovered the following internal Matlab bug (and workaround) that I thought could be useful to some readers, so I changed my plans and the original article will see light next week (or the next, or whenever…).
The bug
Try the following code snippet:
today = fix(now);
ts = timeseries(rand(1,201), datestr(today-200:today));
figure;
hPanel = uipanel('units','norm','pos',[.2,.2,.5,.5]);
hAxes = axes('Parent',hPanel, 'units','norm');
plot(ts, 'Parent',hAxes);
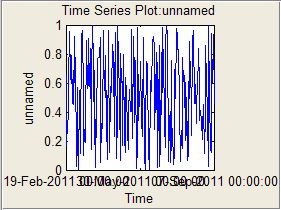
As you can see, the plot’s x-tick labels are all bunched together:

Timeseries plot bug (note x tick labels)
The workaround
I debugged the problem and traced it to line #317 of …\R2011b\toolbox\matlab\timeseries\@timeseries\plot.m (in the R2011b installation):
axpos = hgconvertunits(f,get(ax,'Position'),get(ax,'Units'),'normalized',f);
This line uses hgconvertunits to get the figure-based normalized units of the axes. hgconvertunits is an internal semi-documented helper function that convert a Handle-Graphics position vector in one set of units into another position vector in other units based on some other reference HG object. For example, it can tell me what the position of an internal control is in normalized figure units, even if the control is deeply nested within multiple panels. Which is exactly what it tries to do in this case.
Unfortunately, hgconvertunits apparently has a bug that causes it to return the parent-based normalized position values rather than the figure-based ones in this particular case. This causes the function to think that the axes is much bigger than it really is, and therefore it uses more x-tick labels than it should.
This hgconvertunits bug may very possibly affect numerous other Matlab functions that use this built-in function. The correct fix is to fix the hgconvertunits function. However, since this is an non-modifiable internal function, I found the following workaround for the timeseries plot only, by replacing the above line with the following:
axpos = hgconvertunits(f,getpixelposition(ax,f),'pixel','normalized',f);

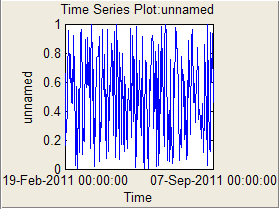
Timeseries plot fix (note x tick labels)
Now the x-tick labels appear nicely, including during resize and zooming.
This problem occurs on R2011b. I was able to recreate the same problem and use the same fix back to R2010b. I do not know how far earlier the bug goes…
I reported the problem today (1-FEM0L7 for anyone interested). If I learn of a patch for hgconvertunits I will post an addendum on this page.


 One thing with the modified code is that it is necessary to add an attachment to send an...
Yair,
Ordered your book on Tuesday. Looking forward to reading it. Any word on a fix for the timeseries plot function?
@Jeff – what do you mean by “any word on a fix?” – my entire post was about the fix… I don’t follow what you mean
Pingback: Pinning annotations to graphs | Undocumented Matlab
In R2016b I replaced call to hgconvertunits with getpixelposition in dateTickPicker.