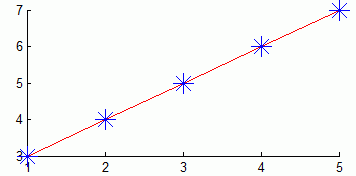
Continuing last week’s article on Matlab Handle Graphics’ (HG) undocumented Behavior functionality, today I describe another undocumented aspect of HG. Some of the low-level HG functions, such as line and patch receive their input parameters in one of two formats:

- The regular fully-documented P-V pairs format:
line('Marker','*', 'MarkerSize',8, 'MarkerEdgeColor','b', ...
     'Color','r', 'XData',1:5, 'YData',3:7)
- An undocumented struct-fields format:
lineprops.Marker = '*';
lineprops.MarkerSize = 15;
lineprops.MarkerEdgeColor = 'b';
lineprops.color = 'r';
lineprops.xdata = 1:5;
lineprops.ydata = 3:7;
line(lineprops)
A sample usage of using the input struct technique can be seen (for example) in %matlabroot%/toolbox/matlab/graphics/@graphics/@datatip/datatip.m. I have also used it in my IB-Marlab application, which connects Matlab to Interactive Brokers. The idea is to make it easy for users to use whichever input format they feel more comfortable with: both P-V pairs or struct fields are supported.
Both input formats can be interchanged and mixed. We should just note that the latest (right-most) property is updated last and overrides any previous value of the same property. Here are some examples — can you guess the results of each of them?
line(lineprops, 'MarkerEdgeColor','g', 'MarkerSize',7) line('MarkerEdgeColor','g', lineprops, 'MarkerSize',7) line('MarkerEdgeColor','g', 'MarkerSize',7, lineprops) line(1:4, 2:5, 'MarkerEdgeColor','g', 'MarkerSize',7, lineprops) line(1:4, 2:5, 'MarkerEdgeColor','g', lineprops, 'MarkerSize',7) line(1:4, 2:5, lineprops, 'MarkerEdgeColor','g', 'MarkerSize',7) |
While the struct format is documented (although not widely-used) in the set function, it is not documented for line, patch and other functions. Nor is it documented that we can mix the struct format with the P-V pairs format.
Note that not all HG functions support the struct input format. For example, line does, but plot does not. I do not understand the reason for this. It would seem reasonable for MathWorks to include this useful struct format for all their HG functions, and since set already supports it the extra effort would have been trivial. Maybe this will still happen in some future Matlab release…


Is this behavior because the functions use INPUTPARSER? If so, perhaps it is true for any function that uses inputparser – I haven’t tested it out to see…
@Eric – both line, patch and inputparser are internal functions whose contents are not accessible for us to check.
[…] Two weeks ago I wrote about Matlab Handle Graphics (HG) undocumented acceptance of structs as input parameter to some plotting functions. Continuing in a related matter, today I expose an undocumented input parameter for HG’s ishghandle function […]
I had also noticed this sometime ago. It would seem very useful to use with:
but unfortunately
get(h)returns read-only properties, which result in an error when used withset():Do you know how to overcome this?
@Miguel – why not simply pass to set only the changed properties, that you can be certain are settable? For example:
Hi, Yair,
Thanks for your reply, and above all, thanks for the continuous stream of pearls you provide…
I would like to use the get() method for two reasons:
– symmetry: it has some aesthetic appeal, feels natural to me;
– laziness: it would allow the use of auto-complete…
not very strong reasons, specially since recent versions of Matlab provide auto-complete of property names in set/get, but still prompted me to write this function:
Unfortunately, although this works for a vector of handles, of same type, returning a vector struct, this can’t be used in
set(...):since only the last value specified for each property is used, and applied to all handle graphics objects…
A syntax for assigning different values to properties of multiple objects is available for the
plot(...)function, which accepts the following:My preferred way of working with handle graphics is to use hg objects instead of handles, although in some cases it requires some additional steps:
Which method (set(…) with PV pairs, set(…) with struct, or hg objects) do you prefer?