Last week, when I presented JFreeChart, I intended to follow it with other articles dedicated to JGraph, JFreeReport and other useful open-source packages that can be used from within Matlab. However, blog follower Scott Koch was quick to post a comment about JGraph and even took the time to add a short code snippet illustrating JGraph’s use. So, I will honor Scott by re-posting his example here.
JGraph
JGraph is an open-source Java library that helps visualize graph-theory objects and connectors. Note that in today’s article we discuss graphs in the sense of connected object trees, not graphs in the sense of x-vs.-y data charts.
To use JGraph, download the JGraphx zip file, then extract the zip file. You’ll get a jgraphx/ subfolder containing separate sub-folders with docs, examples, source-code and a lib/ sub-folder with a jgraphx.jar file. To use JGraph in Matlab, load jgraphx.jar into Matlab’s Java classpath (there is no need to use the static classpath in this case, although you can of course do so if you like):
javaaddpath('jgraphx/lib/jgraphx.jar'); |
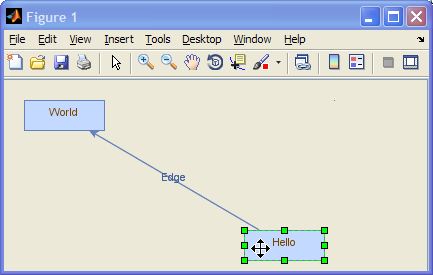
We can now run Scott Koch’s example of using JGraph in Matlab:
% Make the graph object graph = com.mxgraph.view.mxGraph; % Get the parent cell parent = graph.getDefaultParent(); % Group update graph.getModel().beginUpdate(); % Add some child cells v1 = graph.insertVertex(parent, '', 'Hello', 240, 150, 80, 30); v2 = graph.insertVertex(parent, '', 'World', 20, 20, 80, 30); graph.insertEdge(parent, '', 'Edge', v1, v2); graph.getModel().endUpdate(); % Get scrollpane graphComponent = com.mxgraph.swing.mxGraphComponent(graph); % Make a figure and stick the component on it f = figure('units','pixels'); pos = get(f,'position'); mypanel = javax.swing.JPanel(java.awt.BorderLayout); mypanel.add(graphComponent); [obj, hcontainer] = javacomponent(mypanel, [0,0,pos(3:4)], f); |

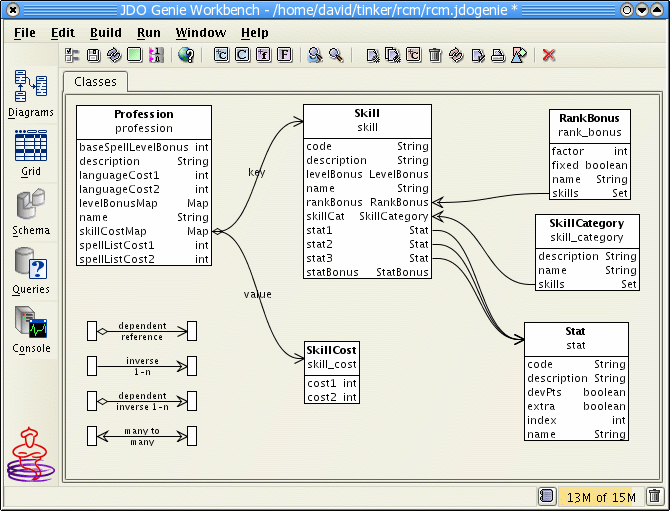
And some more complex JGraph examples, taken from the “official” samples gallery:


JGraphT
JGraphT is another open-source Java-based library. JGraphT is a non-GUI library that provides underlying graph-theory objects and algorithms. These can be used in conjunction with the JGraph visualization library.
The Matlab File Exchange has a submission that wraps JGraphT within Matlab. Apparently, this Matlab utility is a wrapper for the non-GUI JGraphT, but I see no reason not to use JGraph’s GUI visualization capabilities, since JGraphT has an extremely simple JGraph adapter.
BDE
BDE (Block Diagram Editor?) is an internal Matlab Java class library that has been included in Matlab releases for many years, to this day. Judging from the size of this library file (%matlabroot%/java/jar/bde.jar), MathWorks continues to develop BDE, which grows from one release to another.
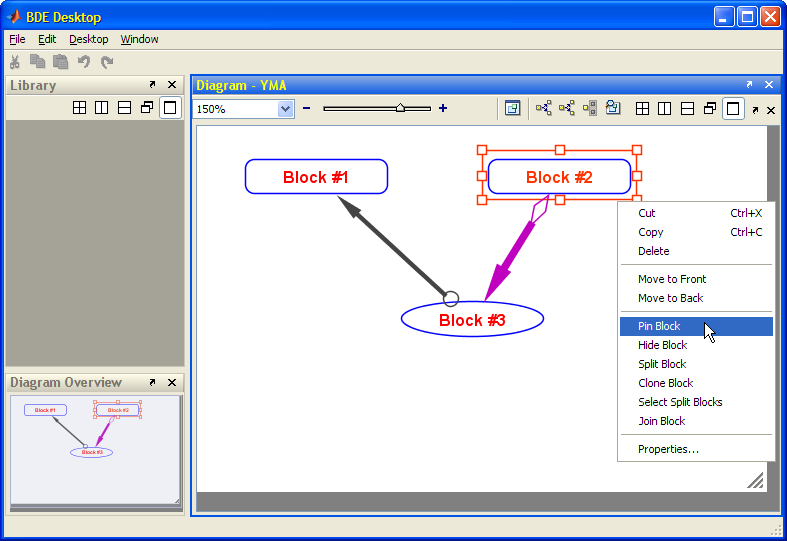
BDE can be used to present and edit block diagrams. The diagrams themselves are stored in XML files in a BDE/ subfolder beneath the user’s prefdir folder. However, I do not know how these diagrams can be used. Here’s a simple usage example:
bde = com.mathworks.bde.clients.BDEDesktop; % fails in R2009b+ diagram = com.mathworks.bde.diagram.Diagram; client = com.mathworks.bde.clients.DiagramViewDTClient('YMA',diagram); bde.addClient(client,'YMA'); |

Note: In Matlab release R2009b, BDE apparently had a major redesign, and the above code no longer works.
I would be happy if anyone could enlighten me regarding the possible usage of BDE, or how it can be ran in one of the latest releases. Please leave a comment below.


“JGraph example within a Matlab figure (the graph is fully interactive)”
Well I still can’t move the vorteces, same problem as Scott mentioned in his comment. Any solution to that?
(Version R2008a)
@Fab – well, while you cannot simply drag the vortexes, you can indeed move them by dragging opposite edges. For example, to move left, first enlarge the vortex leftward by dragging the left-side resize handle, then reduce the size leftward by dragging the right-side resize handle; the end result is that the vortex moved left. Ugly, but it works…
@Fab: There is a way, you can move the vertex (works in 2010a, maybe also in 2008a). The trick is, when you have selected the vertex as shown in the figure after the codesnippet (green dotted border with marker and the double-cross appears) then press the left mouse button (hold on), press the right mouse button (hold on) and with both mouse buttons down move the mouse to the new place for the vertex. Then release the right mouse button first – vertex moves. It is difficult, but with a little training …
About JgraphT and the submission link mentioned above: I tried to follow the instructions in the link and I can’t use the JgraphT in Matlab. When I do ‘which org.matjgraph.MaximalCliques.getMaximalCliques’ it retrives “not found”. First I thought the problem was in the paths to add because the “build” path does not exist. I changed it to match the build.xml file and all the jar files in the \lib\ path and still it does not work.
Does anyone know what can be the problem?
Cheers
(Version R2008a, Windows Vista)
@Akli – did you remember to use javaaddpath for your JGraphT jar file(s)?
Yes, I added the jar files in \lib and the build.xml using the javaaddpath.
@Akli – try to follow the code in the following File Exchange submission: http://www.mathworks.com/matlabcentral/fileexchange/27074
mxGraph/JGraph – Get Drag & Drop (moving vertices), Cut & Paste working
People complained about not being able to move vertices if they start a java application built with mxGraph/JGraph. I experienced the same problem and investigated it. Here’s my solution how to get it working.
This article refers to Matlab R2013a and mxGraph 2.1.0.0 but it should also work with older versions of both.
Both Drag & Drop (which is needed for moving vertices around) and Cut & Paste rely on the mxGraphTransferHandler working correctly. The mxGraphTransferHandler in fact uses its own implementation of Transferable (java.awt.datatransfer.Transferable) called mxGraphTransferable. Have a look at the source code in jgraphx/src/com/mxgraph/swing/util/mxGraphTransferable.java. At the very end you’ll see a static initializer whose job is to construct a suitable DataFlavor (java.awt.datatransfer.DataFlavor). And here is the problem! If you start your mxGraph application from Java’s VM everything works fine. But if you start it from within Matlab’s JVM it cannot find the class com.mxgraph.swing.util.mxGraphTransferable and you’ll get a ClassNotFoundException. As you can see in the code this one is caught but nothing happens (// do nothing). So you do not notice that the Class Loader has a problem and keep wondering why moving vertices does not work (as me).
Now here comes the solution. By the way, I found it in the source code jgraphx/src/com/mxgraph/swing/util/mxGraphTransferable.java at the very top. There it says “Serialized Data Flavor. Use the following code to switch to local reference flavor: …”. In fact this did not work for me. “If you get a class not found exception, try the following instead: …” Et voila! Just insert their code
at the beginning of your java code and moving vertices, Drag & Drop and Cut & Paste works!
Hi!
I’ve been trying to get this working.
Do i need to put this code in my own program or in the jgraphx sources and rebuild it?
I’ve tried running it from my program with no success. I use jgraphx directly from matlab so i rewrote the code snippet for matlab:
What am I doing wrong?
Regards
@Daniel
You don’t need to patch jgraphx’ sources.
From your code I see that you use jgraphx directly on Matlab’s command line (or in a .m file).
I wrote a Java program (where I put my code snippet in right at the beginning), compiled and packed it into a jar. From Matlab’s command line, I use that jar as a kind of library.
Thanks for the post Markus. Here’s how I implemented your suggestion for anyone interested (Daniel).
Overload the mxGraph class. Create a file, mymxGraph.java with the following code:
Next, compile the class (at Matlab command line). Note that I have the jgraphx.jar in the same folder as mymxGraph.java created above which is also my Current Folder in Matlab:
I’m a java amateur so if anyone has improvements to suggest please post them.
Thanks
Yair – just in case you’re still interested (I appreciate that this is a very old post I’m replying to), BDE is short for block diagram editor. It’s part of SimBiology (MathWorks’ product for modelling, simulation and analysis of biological systems, such as pharmacokinetics and systems biology), and is used to graphically lay out components of biological models. If you take a look at the marketing pages on MathWorks website for SimBiology, you’ll see plenty of screenshots that show the component in action.
It’s a MathWorks-authored component, although it may (I’m not sure) be a wrapper around a third-party component. I’m not sure why it’s included as part of MATLAB rather than just SimBiology – perhaps there’s an idea that it might get reused across other products as well.
If anyone is thinking of using it, I would not rely on it to have a stable interface or behaviour across versions: MathWorks may well modify it based on requirements for SimBiology – which, as a leaf product, has much more scope to change rapidly than core MATLAB.
@Sam – thanks for confirming that BDE does indeed stand for Block Diagram Editor as I’ve speculated. As I noted in the main text, MathWorks removed BDE from the core Matlab in R2009b, and it’s not available to the general Matlab user since then. Only users of R2009a and earlier can use it. When I wrote the article in late 2010 (for publication in Jan 2011), R2009a was still widely used. But I believe that it is not very relevant nowadays.