GUIDE is the acronym for Matlab’s Graphical User Interface Design Editor. It is very handy for designing simple GUI figures, although my experience has shown that it has limitations for complex GUIs. Nevertheless, GUIDE is the tool used by most Matlab developers when designing GUIs. In this post, I will show a few undocumented customizations that could help make GUIDE sessions more productive.
The starting point is GUIDE’s undocumented return value, which is a Java reference to the Layout Editor panel within the GUIDE figure frame:
>> h = guide
h =
Layout Document [untitled]
>> h.getClass
ans =
class com.mathworks.toolbox.matlab.guide.LayoutEditor
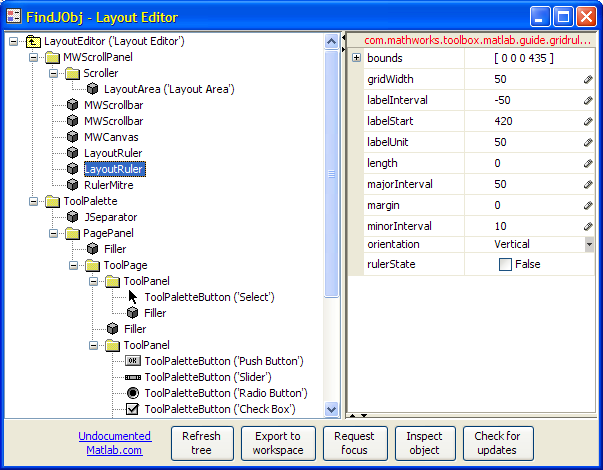
This return handle can be used to access GUIDE components and functionality. We can start by inspecting the interesting GUIDE layout hierarchy using my FindJObj utility, and the associated properties and method using my UIInspect utility:
>> h.findjobj;
>> h.uiinspect;

Note: If you wish to see the hierarchy of the entire GUIDE figure frame, simply run FindJObj on the frame reference, by either of the two following methods (and similarly for UIInspect):
>> findjobj(h.getFrame);
>> findjobj(h.getTopLevelWindow);
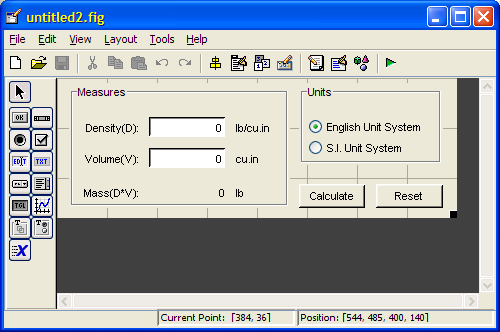
We see that the Layout Editor contains, in addition to the expected LayoutArea and two MWScrollbars, several objects that relate to a ruler. These rulers can be activated via the GUIDE menu (Tools / Grid and Rulers), or via the Matlab Command Prompt as described below:
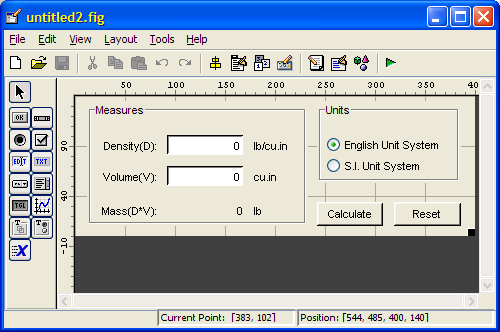
Looking at the ruler properties in FindJObj or UIInspect, we can see a settable boolean property called “RulerState”. If we turn it on we can see that a very handy pixels-ruler appears. Once we set this property, it remains in effect for every future GUIDE session:

Note: RulerState actually controls a system preference (LayoutShowRulers, a boolean flag) that controls the visibility of both rulers, and persists across Matlab/GUIDE sessions. To change the visibility of only a single ruler for this GUIDE session only, or on old Matlab versions (e.g. Matlab 7.1 aka R14 SP3) that do not have the ‘RulerState’ property, use the hide()/show()/setVisible(flag) methods, or set the ‘Visible’ property:

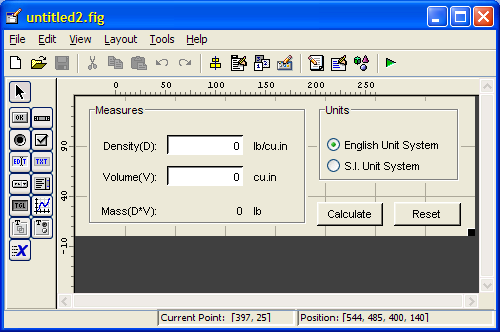
Using this method, we can customize the rulers – options which are unavailable using the standard GUIDE menu options: We can specify horizontal/vertical grid size, tick & label interval and similar ruler properties. For example, let’s set a 5-pixel minor tick interval, 25-pixel major interval, labels every 50 pixels, starting offset of 40 pixels and a ruler size limited at 260 pixels:

Note that the vertical ruler’s labels start (=LabelStart property) at the figure’s height, and have a decreasing LabelInterval of -50. This is done because Java coordinates start counting from the top-left corner downward, whereas Matlab counts from the bottom-left upward. In GUIDE, we naturally wish to display the Matlab coordinates, hence the transformation.
Note: unfortunately, most of these properties do not have equivalent settable system properties that I could find. Here is a list of all the GUIDE-related system properties that I found:
- LayoutShowRulers – boolean, controls display of both rulers
- LayoutShowGuides – boolean, controls display of blue guidelines
- LayoutShowGrid – boolean, controls display of gray gridlines
- LayoutGridWidth – integer, controls the size of the grid boxes
- LayoutSnapToGrid – boolean, controls snap-to-grid behavior
- LayoutActivate – boolean, controls ability to run (activate) unsaved figures without confirmation
- LayoutChangeDefaultCallback – boolean, ??? (I can see this preference in my matlab.prf file but I have no idea what it does or how it got there…)
- LayoutExport – boolean, controls ability to export unsaved figures without confirmation
- LayoutExtension – boolean, controls display of file extension in the GUIDE window title
- LayoutFullPath – boolean, controls display of file path in the GUIDE window title
- LayoutMCodeComments – boolean, controls generation of comments for m-file callbacks
- LayoutToolBar – boolean, controls display of the GUIDE widow toolbar
- LayoutToolNames – boolean, controls display of tool names in the components palette
Have you discovered other undocumented features in GUIDE? If so, please share your findings in the comments section below.
Warning: These undocumented features are way deep in unsupported territory. They depend heavily on Matlab’s internal implementation, which may change without any prior notice between Matlab releases. They work ok on Matlab versions 7.1 (R14 SP3) through 7.6 (R2008a), and perhaps on other versions as well. However, the very next Matlab release might break these features, so beware.


[…] When designing Matlab applications, we can either use Matlab’s designer (guide), or manually position each GUI component programmatically, using its Position property. […]
So why does MatLab have so many features that are undocumented? Seems like some of their undocumented features would actually be useful to the users.
@Jeff – This is a great question, so I decided to expand on it in an upcoming blog article. Stay tuned!
Will do. Thanks for all of your solutions. It’s a big help.
Can this technique be used to change the default units of objects generated in GUIDE to ‘pixels’ or ‘normalized’ (or something else less infuriating than ‘characters’…)?
@Rob – I believe that this might help you: http://undocumentedmatlab.com/blog/getting-default-hg-property-values
Hi, Yahir.
Your work here is excellent and very helpful for all of us.
I have a doubt, is it possible to create a kind of “traffic light” in the Matlab Guide? I want to create a GUI with a traffic light and change the colors of the lamps according to my data and results.
Thanks in advance.
I don’t recommend using Matlab’s GUIDE – it is being replaced with appdesigner in recent releases, and in a few releases GUIDE will no longer be available.
In general, you can always design a traffic light with filled colored circles on an invisible axes.
In legacy (Java-based) figures you can also integrate traffic-light Java components (you can find them online) using the javacomponent function.
In AppDesigner and web-based uifigures in general, you can use the uilamp instrumentation widget.