Undocumented Matlab
  • SERVICES
    • Consulting
    • Development
    • Training
    • Gallery
    • Testimonials
  • PRODUCTS
    • IQML: IQFeed-Matlab connector
    • IB-Matlab: InteractiveBrokers-Matlab connector
    • EODML: EODHistoricalData-Matlab connector
    • Webinars
  • BOOKS
    • Secrets of MATLAB-Java Programming
    • Accelerating MATLAB Performance
    • MATLAB Succinctly
  • ARTICLES
  • ABOUT
    • Policies
  • CONTACT

Customizing figure toolbar background

February 20, 2013 6 Comments

In one of my projects, I needed to present a radar (polar) plot. Such plots are usually drawn on a black background and I wanted all the plot controls to blend into this background.
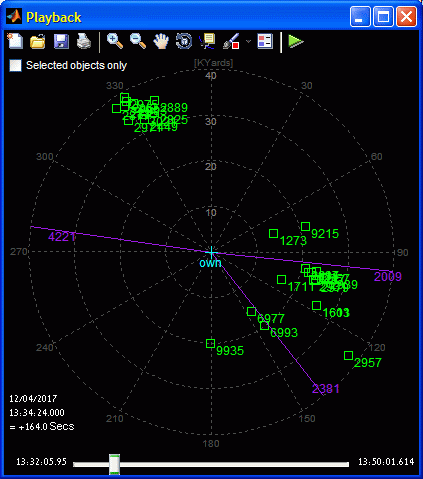
Matlab figure having black toolbar background

For the plot itself I used a variation of Matlab’s buggy polar function, which I modified to enable proper dynamic resize / zoom / pan, bypass figure-renderer issues with patches and data-cursors, and other similar annoyances. Pretty standard stuff.
For the slider I’ve used a javax.swing.JSlider having a continuous-movement callback. Again, for readers of this blog this is nothing special:

[jSlider,hSlider] = javacomponent('javax.swing.JSlider',[0,0,.01,0.1],hFig);
set(hSlider, 'Units','norm','pos',[.15,0,.7,.05]);
set(jSlider, 'Background',java.awt.Color.black, ...
             'Value',0, 'Maximum',duration, ...
             'StateChangedCallback',{@cbSlider,hFig,axPlayback});

[jSlider,hSlider] = javacomponent('javax.swing.JSlider',[0,0,.01,0.1],hFig); set(hSlider, 'Units','norm','pos',[.15,0,.7,.05]); set(jSlider, 'Background',java.awt.Color.black, ... 'Value',0, 'Maximum',duration, ... 'StateChangedCallback',{@cbSlider,hFig,axPlayback});

Setting the background color for all the GUI components to black was easy. But setting the toolbar’s background to black turned out to be a bit more interesting, and is the topic of this week’s article.

Standard Matlab figure toolbar - yuck!

The first step, naturally, is to get the toolbar’s handle:

hToolbar = findall(hFig,'tag','FigureToolBar');

hToolbar = findall(hFig,'tag','FigureToolBar');

In my case, I programmatically create the figure and use the default figure toolbar, whose tag value is always ‘FigureToolBar’. If I had used a custom toolbar, I would naturally use the corresponding tag (for example, if you create a custom toolbar using GUIDE, then the tag name will probably be ‘toolbar1’ or something similar).
Since I’m setting the figure programmatically, I need to manually remove several unuseful toolbar controls. I do this by directly accessing the toolbar control handles:

delete(findall(hToolbar,'tag','Plottools.PlottoolsOn'))
delete(findall(hToolbar,'tag','Plottools.PlottoolsOff'))
delete(findall(hToolbar,'tag','Annotation.InsertColorbar'))
delete(findall(hToolbar,'tag','DataManager.Linking'))
delete(findall(hToolbar,'tag','Standard.EditPlot'))

delete(findall(hToolbar,'tag','Plottools.PlottoolsOn')) delete(findall(hToolbar,'tag','Plottools.PlottoolsOff')) delete(findall(hToolbar,'tag','Annotation.InsertColorbar')) delete(findall(hToolbar,'tag','DataManager.Linking')) delete(findall(hToolbar,'tag','Standard.EditPlot'))

For setting the bgcolor, we get the toolbar’s underlying Java component, then sprinkle some Java magic power:

% ensure the toolbar is visible onscreen
drawnow;
% Get the underlying JToolBar component
jToolbar = get(get(hToolbar,'JavaContainer'),'ComponentPeer');
% Set the bgcolor to black
color = java.awt.Color.black;
jToolbar.setBackground(color);
jToolbar.getParent.getParent.setBackground(color);
% Remove the toolbar border, to blend into figure contents
jToolbar.setBorderPainted(false);
% Remove the separator line between toolbar and contents
jFrame = get(handle(hFig),'JavaFrame');
jFrame.showTopSeparator(false);

% ensure the toolbar is visible onscreen drawnow; % Get the underlying JToolBar component jToolbar = get(get(hToolbar,'JavaContainer'),'ComponentPeer'); % Set the bgcolor to black color = java.awt.Color.black; jToolbar.setBackground(color); jToolbar.getParent.getParent.setBackground(color); % Remove the toolbar border, to blend into figure contents jToolbar.setBorderPainted(false); % Remove the separator line between toolbar and contents jFrame = get(handle(hFig),'JavaFrame'); jFrame.showTopSeparator(false);

Unfortunately, this is not enough. The reason is that some of Matlab’s standard toolbar icons use non-opaque Java button controls (thereby showing the new black bgcolor), whereas other icons use opaque buttons, with a hard-coded gray background (I feel like spanking someone…). I’ve already touched upon this issue briefly a few years ago.

Matlab figure toolbar with black background, some opaque buttons

Luckily, all is not lost: we simply need to loop over all the JToolBar’s components and force them to be non-opaque with a black bgcolor. In cases where the component is compound (e.g., the Brush Data uisplittool), we need to set the bgcolor for all the sub-components:

jtbc = jToolbar.getComponents;
for idx=1:length(jtbc)
    jtbc(idx).setOpaque(false);
    jtbc(idx).setBackground(color);
    for childIdx = 1 : length(jtbc(idx).getComponents)
        jtbc(idx).getComponent(childIdx-1).setBackground(color);
    end
end

jtbc = jToolbar.getComponents; for idx=1:length(jtbc) jtbc(idx).setOpaque(false); jtbc(idx).setBackground(color); for childIdx = 1 : length(jtbc(idx).getComponents) jtbc(idx).getComponent(childIdx-1).setBackground(color); end end

…finally ending up with the blended appearance that appears at the top of this article.

Related posts:

  1. Customizing the standard figure toolbar, menubar – The standard figure toolbar and menubar can easily be modified to include a list of recently-used files....
  2. Toolbar button labels – GUI toolbar button labels can easily be set and customized using underlying Java components. ...
  3. Figure toolbar components – Matlab's toolbars can be customized using a combination of undocumented Matlab and Java hacks. This article describes how to access existing toolbar icons and how to add non-button toolbar components....
  4. Figure toolbar customizations – Matlab's toolbars can be customized using a combination of undocumented Matlab and Java hacks. This article describes how to customize the Matlab figure toolbar....
  5. Adding a search box to figure toolbar – An interactive search-box can easily be added to a Matlab figure toolbar for enhanced user experience. ...
  6. Reverting axes controls in figure toolbar – In R2018b the axes controls were removed from the figure toolbar, but this can be reverted. ...
Figure GUI Java Toolbar Undocumented feature
Print Print
« Previous
Next »
6 Responses
  1. Zheng Liu March 12, 2013 at 06:41 Reply

    Hi Yair:

    Thank you for your contribution, it is an excellent work, if my figure is a GUI (created by GUIDE), how should I change my customized Toolbar’s backgroundcolor? suppose my Toolbar’s Tag is uitoolbar1, thank you very much.

    • Yair Altman March 12, 2013 at 14:34 Reply

      @Zheng – follow the steps outlined in the article, simply modify

      hToolbar = findall(hFig,'tag','FigureToolBar');

      hToolbar = findall(hFig,'tag','FigureToolBar');

      to:

      hToolbar = findall(handles.hObject,'tag','uitoolbar1');

      hToolbar = findall(handles.hObject,'tag','uitoolbar1');

      in your *_OutputFcn() function that is generated by GUIDE.

      The rest of the code in my article should follow this line (use handles.hObject wherever it says hFig in my article).

      • Zheng Liu March 15, 2013 at 08:13

        Dear Yair, thank you very much for your timely reply, your suggestion gave me a very critical help, wish you good luck.

  2. Zheng Liu March 15, 2013 at 18:57 Reply

    Dear Yair:

    I put the two techniques (http://undocumentedmatlab.com/blog/figure-toolbar-customizations/ and http://undocumentedmatlab.com/blog/customizing-figure-toolbar-background/) designed by you together, I hope to change the background while floating the toolbar, this effect has been achieved in function, but there are a few small issues to be resolved, the questions are as follows:
    (1) How should I do to specify the location of the toolbar while floating? unfortunately, my way (jTbar.getUI.setFloating(true,java.awt.Point(0,0));) does not work;
    (2) How should I do to control the emergence and disappear of the toolbar via right-click menu(for example attached to the current GUI figure)? I currently take a drag-and-off style.

    Yours Sincerely.

    My code (in the “*_OutputFcn()” that is generated by GUIDE) is as follows:

    % --- Outputs from this function are returned to the command line.
    function varargout = toolbar_demo_OutputFcn(hObject, eventdata, handles) 
    % varargout  cell array for returning output args (see VARARGOUT);
    % hObject    handle to figure
    % eventdata  reserved - to be defined in a future version of MATLAB
    % handles    structure with handles and user data (see GUIDATA)
     
    % Get default command line output from handles structure
    varargout{1} = handles.output;
    jTbar = get(get(findall(handles.figure_main,'tag','uitoolbar1'),'JavaContainer'),'ComponentPeer');
    color = java.awt.Color.red;
    jTbar.setBackground(color);
    jTbar.getParent.getParent.setBackground(color);
    jtbc = jTbar.getComponents;
    for idx=1:length(jtbc)
        jtbc(idx).setOpaque(false);
        jtbc(idx).setBackground(color);
        for childIdx = 1 : length(jtbc(idx).getComponents)
            jtbc(idx).getComponent(childIdx-1).setBackground(color);
        end
    end
    jTbar.setBorderPainted(false);
    jFrame = get(handle(handles.figure_main),'JavaFrame');
    jFrame.showTopSeparator(false);
    jTbCon = jTbar.getParent;
    jLayout = java.awt.FlowLayout(0,0,0);
    jTbar.setLayout(jLayout);
    jTbar.setFloatable(true);
    jTbar.getUI.setFloating(true,java.awt.Point(0,0));
    jCpts = jTbar.getComponents;
    for i = 1 : length(jCpts)
        jMls = jCpts(i).getMouseListeners;
        for j = 1 : length(jMls)
            if ~isempty(strfind(get(jMls(j),'type'),'FlyOverListener'))
                jCpts(i).removeMouseListener(jMls(j))
                jCls = jCpts(i).getChangeListeners;
                if ~isempty(strfind(get(jCls(1),'type'),'FlyOverListener'))
                    jCpts(i).removeChangeListener(jCls(1))
                end
            end
        end
    end
    hjTbar = handle(jTbar,'CallbackProperties');
    dockUndockCallbackFcn(hjTbar,1,jTbCon)
    set(hjTbar,'AncestorAddedCallback',{@dockUndockCallbackFcn,jTbCon});
     
    function dockUndockCallbackFcn(src, ~, jTbc)
    if src.isFloating
        jWin = src.getTopLevelAncestor;
        jWin.setResizable(true)
        jWin.setPreferredSize(java.awt.Dimension(450,57));
        jWin.setSize(java.awt.Dimension(450,57));
        jTbc.setVisible(false)
        set(jWin,'WindowClosingCallback',@(~,~)jTbc.setVisible(true))
    end

    % --- Outputs from this function are returned to the command line. function varargout = toolbar_demo_OutputFcn(hObject, eventdata, handles) % varargout cell array for returning output args (see VARARGOUT); % hObject handle to figure % eventdata reserved - to be defined in a future version of MATLAB % handles structure with handles and user data (see GUIDATA) % Get default command line output from handles structure varargout{1} = handles.output; jTbar = get(get(findall(handles.figure_main,'tag','uitoolbar1'),'JavaContainer'),'ComponentPeer'); color = java.awt.Color.red; jTbar.setBackground(color); jTbar.getParent.getParent.setBackground(color); jtbc = jTbar.getComponents; for idx=1:length(jtbc) jtbc(idx).setOpaque(false); jtbc(idx).setBackground(color); for childIdx = 1 : length(jtbc(idx).getComponents) jtbc(idx).getComponent(childIdx-1).setBackground(color); end end jTbar.setBorderPainted(false); jFrame = get(handle(handles.figure_main),'JavaFrame'); jFrame.showTopSeparator(false); jTbCon = jTbar.getParent; jLayout = java.awt.FlowLayout(0,0,0); jTbar.setLayout(jLayout); jTbar.setFloatable(true); jTbar.getUI.setFloating(true,java.awt.Point(0,0)); jCpts = jTbar.getComponents; for i = 1 : length(jCpts) jMls = jCpts(i).getMouseListeners; for j = 1 : length(jMls) if ~isempty(strfind(get(jMls(j),'type'),'FlyOverListener')) jCpts(i).removeMouseListener(jMls(j)) jCls = jCpts(i).getChangeListeners; if ~isempty(strfind(get(jCls(1),'type'),'FlyOverListener')) jCpts(i).removeChangeListener(jCls(1)) end end end end hjTbar = handle(jTbar,'CallbackProperties'); dockUndockCallbackFcn(hjTbar,1,jTbCon) set(hjTbar,'AncestorAddedCallback',{@dockUndockCallbackFcn,jTbCon}); function dockUndockCallbackFcn(src, ~, jTbc) if src.isFloating jWin = src.getTopLevelAncestor; jWin.setResizable(true) jWin.setPreferredSize(java.awt.Dimension(450,57)); jWin.setSize(java.awt.Dimension(450,57)); jTbc.setVisible(false) set(jWin,'WindowClosingCallback',@(~,~)jTbc.setVisible(true)) end

  3. masi October 17, 2016 at 20:54 Reply

    Which polar coordinate system did you use for your solution in MATLAB 2013?

    I am trying to integrate your code to MATLAB 2016b `polaraxes` + `warp` in the thread here http://stackoverflow.com/q/40086038/54964

    • Yair Altman October 18, 2016 at 01:33 Reply

      I used a standard radar-plot layout: North is up (0/360 degs); South is down (180 degs); degrees increasing clockwise from top (North pole).

Leave a Reply
HTML tags such as <b> or <i> are accepted.
Wrap code fragments inside <pre lang="matlab"> tags, like this:
<pre lang="matlab">
a = magic(3);
disp(sum(a))
</pre>
I reserve the right to edit/delete comments (read the site policies).
Not all comments will be answered. You can always email me (altmany at gmail) for private consulting.

Click here to cancel reply.

Useful links
  •  Email Yair Altman
  •  Subscribe to new posts (feed)
  •  Subscribe to new posts (reader)
  •  Subscribe to comments (feed)
 
Accelerating MATLAB Performance book
Recent Posts

Speeding-up builtin Matlab functions – part 3

Improving graphics interactivity

Interesting Matlab puzzle – analysis

Interesting Matlab puzzle

Undocumented plot marker types

Matlab toolstrip – part 9 (popup figures)

Matlab toolstrip – part 8 (galleries)

Matlab toolstrip – part 7 (selection controls)

Matlab toolstrip – part 6 (complex controls)

Matlab toolstrip – part 5 (icons)

Matlab toolstrip – part 4 (control customization)

Reverting axes controls in figure toolbar

Matlab toolstrip – part 3 (basic customization)

Matlab toolstrip – part 2 (ToolGroup App)

Matlab toolstrip – part 1

Categories
  • Desktop (45)
  • Figure window (59)
  • Guest bloggers (65)
  • GUI (165)
  • Handle graphics (84)
  • Hidden property (42)
  • Icons (15)
  • Java (174)
  • Listeners (22)
  • Memory (16)
  • Mex (13)
  • Presumed future risk (394)
    • High risk of breaking in future versions (100)
    • Low risk of breaking in future versions (160)
    • Medium risk of breaking in future versions (136)
  • Public presentation (6)
  • Semi-documented feature (10)
  • Semi-documented function (35)
  • Stock Matlab function (140)
  • Toolbox (10)
  • UI controls (52)
  • Uncategorized (13)
  • Undocumented feature (217)
  • Undocumented function (37)
Tags
AppDesigner (9) Callbacks (31) Compiler (10) Desktop (38) Donn Shull (10) Editor (8) Figure (19) FindJObj (27) GUI (141) GUIDE (8) Handle graphics (78) HG2 (34) Hidden property (51) HTML (26) Icons (9) Internal component (39) Java (178) JavaFrame (20) JIDE (19) JMI (8) Listener (17) Malcolm Lidierth (8) MCOS (11) Memory (13) Menubar (9) Mex (14) Optical illusion (11) Performance (78) Profiler (9) Pure Matlab (187) schema (7) schema.class (8) schema.prop (18) Semi-documented feature (6) Semi-documented function (33) Toolbar (14) Toolstrip (13) uicontrol (37) uifigure (8) UIInspect (12) uitable (6) uitools (20) Undocumented feature (187) Undocumented function (37) Undocumented property (20)
Recent Comments
Contact us
Captcha image for Custom Contact Forms plugin. You must type the numbers shown in the image
Undocumented Matlab © 2009 - Yair Altman
This website and Octahedron Ltd. are not affiliated with The MathWorks Inc.; MATLAB® is a registered trademark of The MathWorks Inc.
Scroll to top