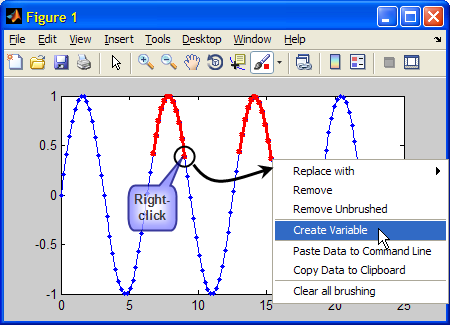
A few days ago, a reader of the Matlab Desktop blog asked whether it is possible to store plot brushed data in a separate variable for later processing. Data Brushing, first introduced in R2008a, enables interactive selection and marking of plot data points. The brushed data can then be stored in a variable using the context (right-click) menu, or the figure’s Tools/Brushing menu.

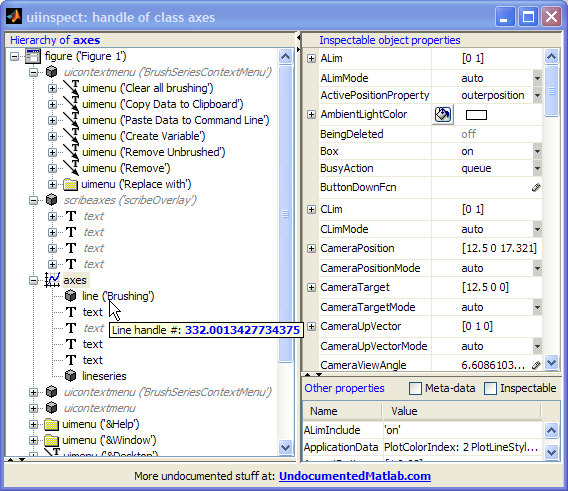
The said reader has specifically wanted programmatic access, rather than interactivity. The official answer is that data brushing was designed to be an interactive tool, and so this cannot be done. However, this has never stopped us before. So off I went to launch my favorite inspection tool, the UIInspect utility on the figure above (UIInspect will be described in a near-future article), which can be recreated with the following simple code:
t=0:0.2:25; plot(t,sin(t),'.-'); % Now brush some data points... uiinspect(gca); |

A couple of alternative answers to the reader’s question were immediately apparent:
Directly accessing brushed data
First, we notice that data brushing added data-brushing context menus, both of which are called BrushSeriesContextMenu (the duplication is an internal Matlab bug, that does not affect usability as far as I can tell).
Also, an invisible scribe overlay axes has been added to hold the new annotations (data brushing is considered an annotation; scribe axes deserve a separate article, which they will indeed get someday).
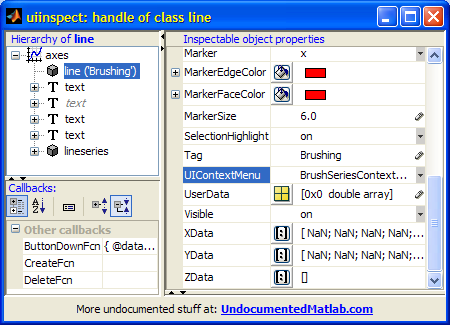
More importantly for our needs, we see a new line item called ‘Brushing’, which displays the red lines and data points that we seek. We can now easily get the brushed data using this line’s XData and YData properties: non-brushed data points simply have NaN values:

hBrushLine = findall(gca,'tag','Brushing'); brushedData = get(hBrushLine, {'Xdata','Ydata'}); brushedIdx = ~isnan(brushedData{1}); brushedXData = brushedData{1}(brushedIdx); brushedYData = brushedData{2}(brushedIdx); % and similarly for ZData in 3D plots |
Accessing brushing callbacks
Yet another way of approaching the problem is to use the available callback functions built-into the data-brushing functionality. We can access either the BrushSeriesContextMenu or the figure’s Tools/Brushing menu. I will leave the former (context-menu) approach as an exercise to the reader, and just describe the figure’s menu approach.
As I have already explained in a dedicated article, figure menu-bar actions are accessible via their handles, and we can retrieve that using a unique tag (well, most of the time – read that article for details). In our case, the Tools/Brushing/Create-new-variable menu item has the unique tag ‘figDataManagerNewVar’. So let’s use it:
>> hNewVarMenuItem = findall(gcf,'tag','figDataManagerNewVar') hNewVarMenuItem = 742.000244140625 >> hNewVarCallback = get(hNewVarMenuItem,'callback') hNewVarCallback = @datamanager.newvar >> hNewVarCallback(gcf) % activate the callback % => set 'ans' as the new variable holding the brushed data >> ans ans = 6.4 0.116549204850494 6.6 0.311541363513379 6.8 0.494113351138609 7 0.656986598718789 7.2 0.793667863849153 7.4 0.898708095811627 7.6 0.967919672031486 7.8 0.998543345374605 ... ... |
Of course, we could also have gone the hard way, via the scribe axes and the annotations route. For masochistic people like me it could even be a worthwhile challenge. But for all other normal people, why bother when there are such simple alternatives, if we only knew how to find them. 🙂
Updates for HG2 (R2014b+)
In HG2 (R2014b+), findall(gca,'tag','Brushing') returns empty data since the way that brushed data is stored has changed. You can access the brushing data using the plot line’s hidden BrushHandles property, as follows:
hLine = plot(...); hBrushHandles = hLine.BrushHandles; hBrushChildrenHandles = hBrushHandles.Children; % Marker, LineStrip |
I described the new Marker objects here, and LineStrip objects here. The brushed vertex data can be retrieved from either of them. For example:
>> hBrushChildrenHandles(1).VertextData ans = 1 2 3 4 % X-data of 4 data points 1 2 3 4 % Y-data of 4 data points 0 0 0 0 % Z-data of 4 data points |
If you only need the brushed data points (not the handles for the Markers and LineStrip, you can get them directly from the line handle, using the hidden BrushData property:
>> brushedIdx = logical(hLine.BrushData); % logical array >> brushedXData = hLine.XData(brushedIdx); >> brushedYData = hLine.YData(brushedIdx) brushedYData = 1 2 3 4 |
Addendum 28 Feb, 2018: MathWorks posted an official post on Matlab Answers that references the BrushData functionality – see here.


Very useful!
I tried it and I have a question.
How can I change the characteristics of the brushing line in a plot (width, size of markers) permanently?
I want these to be valid for every plot I edit and use the brush mode.
I see the default settings are widthline 2.5 pixels and marker’s size 6 for the brushline.
Thank you!
@Lux – unfortunately, brushed lines are implemented in Matlab as simple line plots. Therefore, they share the same default characteristics as the standard line plots and so you cannot change them only for brushed lines.
You can change the defaults for all lines using:
Thank you! It worked.
I created an m file with these two commands and I put it in the target in the shortcut tab of Matlab properties
(matlab icon, right click, properties) so as the settings to be adjusted automatically every time I start Matlab.
Amazing.. thanks.. solved a problem that had been vexing me for too long..
hello, really usefull!!
only one question: suppose I have like 4 plot in a panel, with overlapped axes on left and right (each plot is a class with linked data….etc etc). Now i have like 7 or more lines with a specific tag (like: line1,line2,line3…). If I brush the ‘line2’ ‘line4’ and ‘line6′, and then I use: hBrushLine = findall(handleOfFigure,’tag’,’Brushing’), how can I understand to which line is referred the brush?
Is there a method to set the tag to the brushing object when it is created? like: brushLine2….
hope I was clear
thank you very much!!
marco
Here’s a way to directly access the brushing lineseries handle of a plot lineseries:
This works on the R2011b pre-release that I’m currently using – I’m not sure if it also works on older releases.
I didn’t know anything about data brushing, It’s quite useful, and makes my job much more simple. Thanks again for your posts.
[…] data-cursor mode shares many similarities in behavior and programming code with the other plot modes (zoom, pan, data-brushing, etc.). At any one time, only a single such mode can be active in any figure window […]
I am developing a GUI for viewing large amounts of data: currently about 250 plots, but this will go up. I have two axes in this figure with many other options. I plot all data sets in the upper plot during initialization and then use the ‘Visible’ option for determining which plots are seen. When I click one of these plots in the upper axis it appears in the lower axis. In this lower axis the user has the option to select a peak using brushing. The brushed data is then fit to some function. At this point I would like to remove the brushed data programmatically. To do this I get the function handle for the ‘Clear all brushing’ item in the uicontextmenu that pops up when you right-click on brushed data:
This, however, is not working. Any suggestions would be greatly appreciated.
@James – try using the hgfeval function rather than invoking the callback function directly
hgfeval worked very nicely, thank you! In the end, I found it was a bit faster to have the user select a region of interest (ROI) using ginput and then use a function called “draggable.m”–from the FEX–to make the ROI movable in the axis. I am very glad to know of hgfeval for the future though!
Hi i was wondering how the access to the brushed data works when the brush is used multiple times. It seems to me that
only gives the brush indices of the most recent brush usage.
Lets say you have one (or multiple) curve in a plot like:
and you use the brush twice to delete the first ten and the last ten points. I would like to access the XData and YData of the still visible datapoints. The mentioned code only gives the most recent usage of the brushed data (so in this example the deleted last 10 points). I couldn’t see so far how i can access all the brush instances.
How does this scale if you have n curves?
Thanks a lot
Since Matlab R2014b this method doesn’t seem to work anymore.
hBrushLine is empty after running the following code:
best regards
@bash0r – in HG2 (R2014b+), you can access the brushing data using the plot line’s hidden BrushHandles property, as follows:
I described the new
Markerobjects here, andLineStripobjects here. The brushed vertex data can be retrieved from either of them. For example:If you only need the brushed data points (not the handles for the
MarkersandLineStrip, you can get them directly from the line handle, using the hidden BrushData property:i try this for getting the brush data in matlab 15b but it is now working.
why?.
@Rahul – the code that I posted above works well even in R2016b
Great article! Any suggestions for setting the brush data programmatically? For example, to display all the points that meet a certain criteria?
You can set the brush data using the set command with your line handle, just like you would set the XData or YData.
Shalom Yair!
I have a GUI that I would like to have the interactive option of deleting scatter points with Brush function. My code is:
It seems like the pause is just not working. If I debug and put a breakpoint after the pause it jumps right to it without letting me grab the brush data.
I used brush with pause in matlab 2013 (with the findall(gca,’tag’,’Brushing’); to get the brush data) and it worked fine. I’ll mention that the GUI is a child GUI and it has uiwait in the openning function (Maybe it is related but in matlab 2013 it did’nt bother).
Thank you very much for your help!
Nimrod
Thanks! What a great article. Your update in the comments for R2104b+ saved me. How do you find hidden line properties like BrushData?
@Bill – http://undocumentedmatlab.com/blog/getundoc-get-undocumented-object-properties
@Yair Altman
findall(gca,’tag’,’Brushing’) returns zero on my machine. I’m using R2016b.
@Eric – see my comment above: http://undocumentedmatlab.com/blog/accessing-plot-brushed-data#comment-345181
Hello,
Is there a way to access brushed data for Scatters in Matlab 2015b? I was able to get it to work in 2012a using your first method described above, but your method described in “Updates for HG2 (R2014b+)” doesn’t seem to work. I tried the following, with the following results:
Just to reiterate, this is specifically for scatters, not plots.
Thanks!
@ZR – if you read my article carefully you will see that BrushHandles and BrushData are properties of the line object (which is returned by the plot or line or scatter functions) – not of the axes object.