Undocumented Matlab
  • SERVICES
    • Consulting
    • Development
    • Training
    • Gallery
    • Testimonials
  • PRODUCTS
    • IQML: IQFeed-Matlab connector
    • IB-Matlab: InteractiveBrokers-Matlab connector
    • EODML: EODHistoricalData-Matlab connector
    • Webinars
  • BOOKS
    • Secrets of MATLAB-Java Programming
    • Accelerating MATLAB Performance
    • MATLAB Succinctly
  • ARTICLES
  • ABOUT
    • Policies
  • CONTACT

copyobj behavior change in HG2

May 13, 2015 No Comments

As a followup to last-week’s post on class-object and generic data copies, I would like to welcome back guest blogger Robert Cumming, who developed a commercial Matlab GUI framework. Today, Robert will highlight a behavior change of Matlab’s copyobj function in HG2.
One of the latest features that was introduced to the GUI Toolbox was the ability to undock or copy panels, that would be displayed in a standalone figure window, but remain connected to the underlying class object:
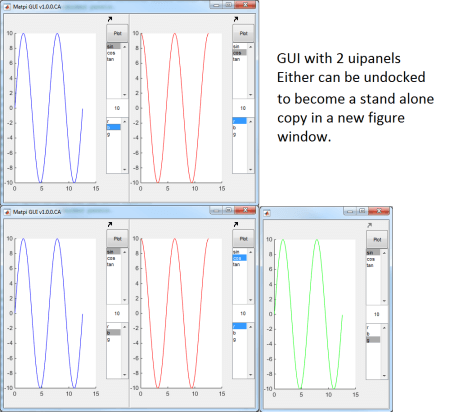
Panel copy in the GUI framework toolbox

These panel copies had to remain fully functional, including all children and callbacks, and they needed to retain all connections back to the source data. In the example above I have altered the plot to show that it’s an actual copy of the data, but has separate behavior from the original panel.
To simply undock a uipanel to a new figure, we can simply re parent it by updating its Parent property to the new figure handle. To make a copy we need to utilize the copyobj function, rather than re-parenting. copyobj can be used to make a copy of all graphic objects that are “grouped” under a common parent, placing their copy in a new parent. In HG2 (R2014b onwards) the default operation of copyobj has changed.

When I started developing this feature everything looked okay and all the objects appeared copied. However, none of the callbacks were functional and all the information stored in the object’s ApplicationData was missing.
I had used copyobj in the past, so I knew that it originally worked ok, so I investigated what was happening. Matlab’s documentation for HG2 code transition suggests re-running the original code to create the second object to populate the callbacks. Unfortunately, this may not be suitable in all cases. Certainly in this case it would be much harder to do, than if the original callbacks had been copied directly. Another suggestion is to use the new ‘lagacy’ option’:

copyobj(___,’legacy’) copies object callback properties and object application data. This behavior is consistent with versions of copyobj before MATLAB® release R2014b.

So, instead of re-running the original code to create the second object to populate the callbacks, we can simply use the new ‘legacy’ option to copy all the callbacks and ApplicationData:

copyobj(hPanel, hNewParent, 'legacy')

copyobj(hPanel, hNewParent, 'legacy')

Note: for some reason, this new ‘legacy’ option is mentioned in both the doc page and the above-mentioned HG2 code-transition page, but not in the often used help section (help copyobj). There is also no link to the relevant HG2 code-transition page in either the help section or the doc page. I find it unfortunate that for such a backward-incompatible behavior change, MathWorks has not seen fit to document the information more prominently.
Other things to note (this is probably not an exhaustive list…) when you are using copyobj:

  • Any event listeners won’t be copied
  • Any uicontextmenus will not be copied – it will in fact behave strangely due to the fact that it will have the uicontextmenu – but the parent is the original figure – and when you right-click on the object it will change the figure focus. For example:
    hFig= figure;
    ax = axes;
    uic = uicontextmenu ('parent', hFig);
    uim = uimenu('label','My Label', 'parent',uic);
    ax.UIContextMenu = uic;
    copyChildren = copyobj (ax, hFig, 'legacy');
    hFig2 = figure;
    copyChildren.Parent = hFig2;

    hFig= figure; ax = axes; uic = uicontextmenu ('parent', hFig); uim = uimenu('label','My Label', 'parent',uic); ax.UIContextMenu = uic; copyChildren = copyobj (ax, hFig, 'legacy'); hFig2 = figure; copyChildren.Parent = hFig2;

Another note on undocked copies – you will need to manage your callbacks appropriately so that the callbacks manage whether they are being run by the original figure or in a new undocked figure.

Conclusions

  1. copyobj has changed in HG2 – but the “legacy” switch allows you to use it as before.
  2. It is unfortunate that backward compatibility was not fully preserved (nor documented enough) in HG2, but at least we have an escape hatch in this case.
  3. Take care with the legacy option as you may need to alter uicontextmenus and re-attach listeners as required.

Related posts:

  1. Property value change listeners – HG handle property changes can be trapped in a user-defined callback. ...
  2. Handle Graphics Behavior – HG behaviors are an important aspect of Matlab graphics that enable custom control of handle functionality. ...
  3. Undocumented scatter plot behavior – The scatter plot function has an undocumented behavior when plotting more than 100 points: it returns a single unified patch object handle, rather than a patch handle for each specific point as it returns with 100 or less points....
  4. xlsread functionality change in R2012a – The functionality of the xlsread function has changed without documentation or warning in the R2012a release. ...
  5. uicontextmenu performance – Matlab uicontextmenus are not automatically deleted with their associated objects, leading to leaks and slow-downs. ...
  6. Performance: accessing handle properties – Handle object property access (get/set) performance can be significantly improved using dot-notation. ...
Callbacks Handle graphics HG2 Pure Matlab Robert Cumming
Print Print
« Previous
Next »
Leave a Reply
HTML tags such as <b> or <i> are accepted.
Wrap code fragments inside <pre lang="matlab"> tags, like this:
<pre lang="matlab">
a = magic(3);
disp(sum(a))
</pre>
I reserve the right to edit/delete comments (read the site policies).
Not all comments will be answered. You can always email me (altmany at gmail) for private consulting.

Click here to cancel reply.

Useful links
  •  Email Yair Altman
  •  Subscribe to new posts (email)
  •  Subscribe to new posts (feed)
  •  Subscribe to new posts (reader)
  •  Subscribe to comments (feed)
 
Accelerating MATLAB Performance book
Recent Posts

Speeding-up builtin Matlab functions – part 3

Improving graphics interactivity

Interesting Matlab puzzle – analysis

Interesting Matlab puzzle

Undocumented plot marker types

Matlab toolstrip – part 9 (popup figures)

Matlab toolstrip – part 8 (galleries)

Matlab toolstrip – part 7 (selection controls)

Matlab toolstrip – part 6 (complex controls)

Matlab toolstrip – part 5 (icons)

Matlab toolstrip – part 4 (control customization)

Reverting axes controls in figure toolbar

Matlab toolstrip – part 3 (basic customization)

Matlab toolstrip – part 2 (ToolGroup App)

Matlab toolstrip – part 1

Categories
  • Desktop (45)
  • Figure window (59)
  • Guest bloggers (65)
  • GUI (165)
  • Handle graphics (84)
  • Hidden property (42)
  • Icons (15)
  • Java (174)
  • Listeners (22)
  • Memory (16)
  • Mex (13)
  • Presumed future risk (394)
    • High risk of breaking in future versions (100)
    • Low risk of breaking in future versions (160)
    • Medium risk of breaking in future versions (136)
  • Public presentation (6)
  • Semi-documented feature (10)
  • Semi-documented function (35)
  • Stock Matlab function (140)
  • Toolbox (10)
  • UI controls (52)
  • Uncategorized (13)
  • Undocumented feature (217)
  • Undocumented function (37)
Tags
ActiveX (6) AppDesigner (9) Callbacks (31) Compiler (10) Desktop (38) Donn Shull (10) Editor (8) Figure (19) FindJObj (27) GUI (141) GUIDE (8) Handle graphics (78) HG2 (34) Hidden property (51) HTML (26) Icons (9) Internal component (39) Java (178) JavaFrame (20) JIDE (19) JMI (8) Listener (17) Malcolm Lidierth (8) MCOS (11) Memory (13) Menubar (9) Mex (14) Optical illusion (11) Performance (78) Profiler (9) Pure Matlab (187) schema (7) schema.class (8) schema.prop (18) Semi-documented feature (6) Semi-documented function (33) Toolbar (14) Toolstrip (13) uicontrol (37) uifigure (8) UIInspect (12) uitools (20) Undocumented feature (187) Undocumented function (37) Undocumented property (20)
Recent Comments
  • Marcel (9 days 13 hours ago): Hi, I am trying to set the legend to Static, but this command seems not to work in R2022a anymore: set(gca,’LegendColorbarL isteners’,[]); Any ideas? THANKS / marcel
  • Gres (9 days 17 hours ago): In 2018b, you can get the icons by calling [hh,icons,plots,txt] = legend({‘Line 1’});
  • Yair Altman (11 days 12 hours ago): @Mitchell – in most cases the user wants a single string identifier for the computer, that uniquely identifies it with a distinct fingerprint that is different from any...
  • Mitchell (11 days 21 hours ago): Great post! I’m not very familiar with the network interfaces being referenced here, but it seems like the java-based cross-platform method concatenates all network...
  • Yair Altman (14 days 14 hours ago): Dani – You can use jViewport.setViewPosition(java .awt.Point(0,0)) as I showed in earlier comments here
  • dani (15 days 10 hours ago): hi!! how i can set the horizontal scrollbar to the leftside when appearing! now it set to right side of text
  • Yair Altman (24 days 6 hours ago): Dom – call drawnow *just before* you set hLine.MarkerHandle.FaceColorTy pe to 'truecoloralpha'. Also, you made a typo in your code: it’s truecoloralpha, not...
  • Dom (25 days 5 hours ago): Yair I have tried your code with trucoloralpha and the markers do not appear transparent in R2021b, same as for Oliver.
  • Yair Altman (28 days 12 hours ago): Ren – This is usually the expected behavior, which avoids unnecessary duplications of the Excel process in CPU/memory. If you want to kill the process you can always run...
  • Yair Altman (29 days 2 hours ago): When you use plot() without hold(‘on’), each new plot() clears the axes and draws a new line, so your second plot() of p2 caused the first plot() line (p1) to be...
  • Cesim Dumlu (35 days 9 hours ago): Hello. I am trying to do a gradient plot for multiple functions to be displayed on the same axes and each one is colorcoded by respective colordata, using the same scaling. The...
  • Yair Altman (43 days 12 hours ago): @Veronica – you are using the new version of uitree, which uses HTML-based uifigures, and my post was about the Java-based uitree which uses legacy Matlab figures. For...
  • Veronica Taurino (43 days 13 hours ago): >> [txt1,txt2] ans = ‘abrakadabra’
  • Veronica Taurino (43 days 13 hours ago): Hello, I am just trying to change the uitree node name as you suggested: txt1 = 'abra'; txt2 = 'kadabra'; node.setName([txt1,txt2]); >> "Unrecognized method, property, or...
  • Yair Altman (46 days 13 hours ago): The version of JGraph that you downloaded uses a newer version of Java (11) than the one that Matlab supports (8). You need to either (1) find an earlier version of JGraph that...
Contact us
Undocumented Matlab © 2009 - Yair Altman
This website and Octahedron Ltd. are not affiliated with The MathWorks Inc.; MATLAB® is a registered trademark of The MathWorks Inc.
Scroll to top