I would like to introduce guest blogger Robert Cumming, an independent contractor based in the UK who has recently worked on certification of the newest advanced civil aircraft. Today Robert will discuss the performance of uicontextmenus in interactive GUIs, which were used extensively in flight test analysis.
Have you ever noticed that a GUI slows down over time? I was responsible for designing a highly complex interactive GUI, which plotted flight test data for engineers and designers to analyze data for comparison with pre-flight predictions. This involved extensive plotting of data (pressure, forces/moments, anemometry, actuator settings etc….), where individual data points were required to have specific/customizable uicontextmenus.
Matlab’s documentation on uicontextmenus discusses adding them to plots, but makes no mention of the cleaning up afterwards.
Let’s start with some GUI basics. First we create a figure with a simple axes and a line:
x = [-10:0.2:10]; y = x.^2; h = figure; ax = axes ( 'parent',h ); hplot = plot ( ax, x, y ); |
Adding a uicontextmenu to the plot creates extra objects:
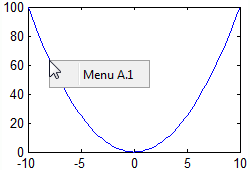
uic = uicontextmenu; uimenu ( uic, 'Label','Menu A.1' ); set ( hplot, 'uicontextmenu',uic ); fprintf ( 'Figure (h) has %i objects\n', length ( findobj ( h ) ) ); |
In this instance there are 5 objects, the individual menu and uicontextmenu have created an additional 2 objects. All of this is quite basic as you would expect.

We now clear the plot using cla and draw a new line with its own new uicontextmenu. Note that we don’t save the plot handle this time:
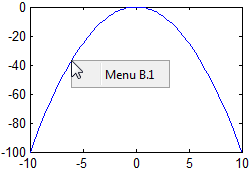
cla ( ax ); uic = uicontextmenu; uimenu ( uic, 'Label','Menu B.1' ); plot ( ax, x, -y , 'uicontextmenu',uic ); fprintf ( 'Figure (h) has %i objects\n', length ( findobj ( h ) ) ); |

This time the fprintf line tells us that the figure has 7 objects. This may not have been expected, as the first plot was cleared and the original context menu is no longer accessible (cla removed the plot and the line object hplot).
Let’s check these object handles:
>> ishandle ( findobj( h ) )' ans = 1 1 1 1 1 1 1 1 1 1 1 1 1 |
We see that all the objects are valid handles. At first this may perhaps appear confusing: after all, the plot with “Menu A.1” was deleted. Let’s check this:
>> ishandle ( hplot ) ans = 0 >> get(hplot) Error using handle.handle/get Invalid or deleted object. |
So it appears that although the plot line was indeed deleted, its associated context menu was not. The reason for this is that the context menu is created as a child of the figure window, not the plot. We are simply using the plot line’s UIContextMenu property to allow the user to obtain access to it and its associated menus.
Once we understand this we can do two things:
- Use the same uicontextmenu for each plot
- Built individual uicontextmenus for each plot, but remember to clean up afterwards
Is this really such a big issue?
You may be wondering how big a problem is this creation of extra objects. The answer is that for simple cases like this it is really not a big issue. But let’s consider a more realistic case where we also assign callbacks to the menus. First we will create a figure with an axes, for plotting on and a uicontrol edit for displaying a message:
function uicontextExample h.main = figure; h.ax = axes ( 'parent',h.main, 'NextPlot','add', 'position',[0.1 0.2 0.8 0.7] ); h.msg = uicontrol ( 'style','edit', 'units','normalized', 'position',[0.08 0.01 0.65 0.1], 'backgroundcolor','white' ); uicontrol ( 'style','pushbutton', 'units','normalized', 'position',[0.75 0.01 0.2 0.1], 'Callback',{@RedrawX20 h}, 'string','re-draw x20' ); redraw ( [], [], h ) % see below end |
The callback redraw (shown below) draws a simple curve and assigns individual uicontextmenus to each individual item in the plot. Each uicontextmenu has 12 menu items:
function redraw ( obj, event, h, varargin ) cla(h.ax); start = tic; x = -50:50; y = x.^2; for ii = 1 : length(x) uim = uicontextmenu ( 'parent',h.main ); for jj = 1 : 10 menuLabel = sprintf ( 'Menu %i.%i', ii, jj ); uimenu ( 'parent',uim, 'Label',menuLabel, 'Callback',{@redraw h} ) end xStr = sprintf ( 'X = %f', x(ii) ); yStr = sprintf ( 'Y = %f', y(ii) ); uimenu ( 'parent',uim, 'Label',xStr, 'Callback',{@redraw h} ) uimenu ( 'parent',uim, 'Label',yStr, 'Callback',{@redraw h} ) plot ( h.ax, x(ii), y(ii), 'rs', 'uicontextmenu',uim ); end objs = findobj ( h.main ); s = sprintf ( 'figure contains %i objects - drawn in %3.2f seconds', length(objs), toc(start) ); set ( h.msg, 'string',s ); fprintf('%s\n',s) end |
To help demonstrate the slow-down in speed, the pushbutton uicontrol will redraw the plot 20 times, and show the results from the profiler:
function RedrawX20 ( obj, event, h ) profile on set ( obj, 'enable','off' ) for ii = 1 : 20 redraw ( [], [], h ); drawnow(); end set ( obj, 'enable','on' ) profile viewer end |
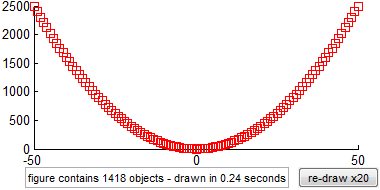
The first time we run this, on a reasonable laptop it takes 0.24 seconds to draw the figure with all the menus:

When we press the <re-draw x20> button we get:
figure contains 2731 objects - drawn in 0.28 seconds figure contains 4044 objects - drawn in 0.28 seconds figure contains 5357 objects - drawn in 0.28 seconds figure contains 6670 objects - drawn in 0.30 seconds figure contains 7983 objects - drawn in 0.32 seconds figure contains 9296 objects - drawn in 0.30 seconds figure contains 10609 objects - drawn in 0.31 seconds figure contains 11922 objects - drawn in 0.30 seconds figure contains 13235 objects - drawn in 0.32 seconds figure contains 14548 objects - drawn in 0.30 seconds figure contains 15861 objects - drawn in 0.31 seconds figure contains 17174 objects - drawn in 0.31 seconds figure contains 18487 objects - drawn in 0.32 seconds figure contains 19800 objects - drawn in 0.33 seconds figure contains 21113 objects - drawn in 0.32 seconds figure contains 22426 objects - drawn in 0.33 seconds figure contains 23739 objects - drawn in 0.35 seconds figure contains 25052 objects - drawn in 0.34 seconds figure contains 26365 objects - drawn in 0.35 seconds figure contains 27678 objects - drawn in 0.35 seconds |
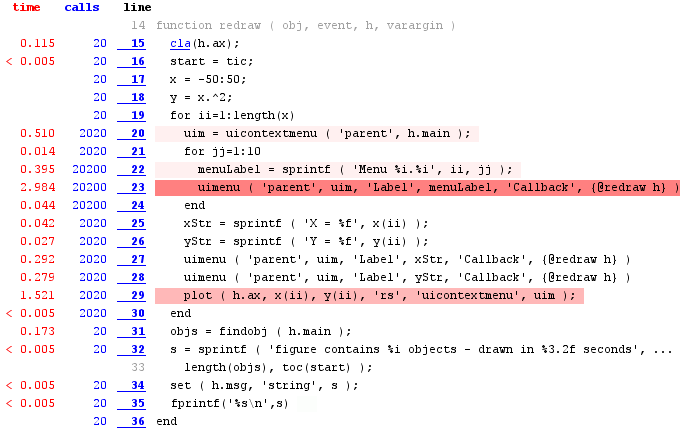
The run time shows significant degradation, and we have many left-over objects. The profiler output confirms where the time is being spent:

As expected the menus creation takes most of the time. Note that the timing that you will get on your own computer for this example may vary and the slowdown may be less noticeable.
Let’s extend the example to include extra input arguments in the callback (in this example they are not used – but in the industrial example extra input arguments are very possible, and were required by the customer):
for ii=1:length(x) uim = uicontextmenu ( 'parent',h.main ); for jj = 1 : 10 menuLabel = sprintf ( 'Menu %i.%i', ii, jj ); uimenu ( 'parent',uim, 'Label',menuLabel, 'Callback',{@redraw h 1 0 1} ) end xStr = sprintf ( 'X = %f', x(ii) ); yStr = sprintf ( 'Y = %f', y(ii) ); uimenu ( 'parent',uim, 'Label',xStr, 'Callback',{@redraw h 1 0 1} ) uimenu ( 'parent',uim, 'Label',yStr, 'Callback',{@redraw h 1 0 1} ) plot ( h.ax, x(ii), y(ii), 'rs', 'uicontextmenu',uim ); end |
Re-running the code and pressing <re-draw x20> we get:
figure contains 1418 objects - drawn in 0.29 seconds figure contains 2731 objects - drawn in 0.37 seconds figure contains 4044 objects - drawn in 0.48 seconds figure contains 5357 objects - drawn in 0.65 seconds ... figure contains 23739 objects - drawn in 4.99 seconds figure contains 25052 objects - drawn in 5.34 seconds figure contains 26365 objects - drawn in 5.88 seconds figure contains 27678 objects - drawn in 6.22 seconds |
Note that the 6.22 seconds is just the time that it took the last individual redraw, not the total time to draw 20 times (which was just over a minute). The profiler is again used to confirm that the vast majority of the time (57 seconds) was spent in the uimenu calls, mostly on line #23. In comparison, all other lines together took just 4 seconds to run.
The simple act of adding extra inputs to the callback has completely transformed the speed of our code.
How real is this example?
In code written for a customer, the context menu had a variety of sub menus (dependent on the parameter being plotted – from 5 to ~20), and they each had multiple parameters passed into the callbacks. Over a relatively short period of time the user would cycle through a lot of data and the number of uicontextmenus being created was surprisingly large. For example, users would easily look at 100 individual sensors recorded at 10Hz for 2 minutes (100*10*60*2). If all sensors and points are plotted individually that would be 120,000 uicontextmenus!
So how do we resolve this?
The problem is addressed by simply deleting the context menu handles once they are no longer needed. This can be done by adding a delete command after cla at the top of the redraw function, in order to remove the redundant uicontextmenus:
function redraw ( obj, event, h, varargin ) cla(h.ax); delete ( findobj ( h.main, 'type','uicontextmenu' ) ) set ( h.msg, 'string','redrawing' ); start = tic; ... |
If we now click <redraw x20> we see that the number of objects and the time to create them remain its essentially the same as the first call: 1418 objects and 0.28 seconds:
figure contains 1418 objects - drawn in 0.28 seconds figure contains 1418 objects - drawn in 0.30 seconds figure contains 1418 objects - drawn in 0.33 seconds figure contains 1418 objects - drawn in 0.29 seconds figure contains 1418 objects - drawn in 0.29 seconds ... |
Advanced users could use handle listeners to attached a callback such that when a plot element is deleted, so too are its associated context menus.
Conclusions
Things to consider with uicontextmenus:
- Always delete uicontextmenus that you have finished with.
- If you have multiple uicontextmenus you will want to only delete the ones associated with the axes being cleared – otherwise you will delete more than you want to.
- Try to reduce the number of input arguments to your callbacks, group into a structure or cell array.
- Re-use uicontextmenus where possible.
Have you had similar experiences? Or other issues where GUI slow down over time? If so, please leave a comment below.


Instead of creating hundreds of uicontextmenu which are pretty identical, I think you/one should rather make a single, but smart uicontextmenu.
You most certainly won’t have hundreds of different “handmade” uicontextmenus.
I’m pretty sure in most of such cases one can either
a) make the callbacks of the individual uimenu-entries dynamic, e.g. to act on the just clicked handle
or
b) make the uicontextmenu itself dynamic, by implementing an on-the-fly creation of its menus using the ‘Callback’ of the uicontextmenu.
E.g. in your example you could add the ‘X=…’ and ‘Y=…’ in the very beginning and simply change their labels according to which object was clicked by the user.
Sebastian – thanks for your comments.
Indeed you are correct – its always best to be smart 🙂
The example above is trivialising what was a very complex GUI with many individual and customisable uicontextmenus – even the “real world” example I quoted was not what was really done, but trying to provide some generalised numbers on how many objects can be created if you don’t take care.
The scenario I was showing here was to highlight that you should clean up uicontextmenus once they are no longer required/accessible (true for other objects too).
In both of your cases you would still need to clean up the uicontextmenu handle(s) after they have been used/no longer accessible, as the more objects you have the slower anything that uses findobj would become for example.
Robert,
It is always a great deal of vexation, when some GUI components (UI-context-menus) are not associated to their natural object (plot/axes/etc.), which leads to confusion, and sometimes, as you have shown, to a significant slowdown; thank you for pointing that out for context menus. Yet I believe that your solution is incorrect in this case.
The reason is very simple: when you delete the context menus with
you remove all the associated handles inside the figure; that may pose a significant problem if you have several axes with context-menus in the figure. Using listeners will not solve the issue (unless you use a different
XObjectDeletedEventfor each axis), and may introduce additional peculiarities, since Matlab’s event-driving mechanism flushes the graphics in its own time (see drawnow for more details).What I suggest, is using Matlab’s own
DeleteFcnmechanism. More specifically, since the plot handles have bothDeleteFcnand the linkedUIContextMenuhandle, we may use it together to obtain —so that when the plot is deleted, the associated
UIContextMenuis removed as well. On my laptop it has shown the same improvement in runtime as in your example of deleting all the context-menus in the figure whilst retaining the linkage between the plot and the menu.Yaroslav,
Thank you for your comment – and indeed you are correct the solution above is a bit of a “sledge hammer” approach.
The point you make was (supposed to be anyway…) covered in point 2 of the conclusions – you need to take care and only delete the appropriate uicontextmenus.
Your solution is a good improvement for the reader of this blog! 🙂 And a reminder to me to explain in more detail in the future!
Regards
Hi Yair,
Is it possible to have multiple objects share the same uicontextmenu? I’ve tried it but the problem is I don’t know how to figure out which object is right-clicked on (the callback only contains the context menu object itself)… is there some sort of (possibly java-based) workaround or do you have to use a separate uicontextmenu for each object and label it somehow? Thanks!
Niko
Niko,
I know this was years ago and you’ve almost certainly resolved this, but you can get the calling object via the figure’s CurrentObject property. So from the callback:
This answer really came from MVP Jan:
https://www.mathworks.com/matlabcentral/answers/67685-how-do-i-find-out-which-uicontrol-launched-my-context-menu