Undocumented Matlab
  • SERVICES
    • Consulting
    • Development
    • Training
    • Gallery
    • Testimonials
  • PRODUCTS
    • IQML: IQFeed-Matlab connector
    • IB-Matlab: InteractiveBrokers-Matlab connector
    • EODML: EODHistoricalData-Matlab connector
    • Webinars
  • BOOKS
    • Secrets of MATLAB-Java Programming
    • Accelerating MATLAB Performance
    • MATLAB Succinctly
  • ARTICLES
  • ABOUT
    • Policies
  • CONTACT

Customizing contour plots part 2

November 12, 2017 9 Comments

A few weeks ago a user posted a question on Matlab’s Answers forum, asking whether it is possible to display contour labels in the same color as their corresponding contour lines. In today’s post I’ll provide some insight that may assist users with similar customizations in other plot types.
Matlab does not provide, for reasons that escape my limited understanding, documented access to the contour plot’s component primitives, namely its contour lines, labels and patch faces. Luckily however, these handles are accessible (in HG2, i.e. R2014b onward) via undocumented hidden properties aptly named EdgePrims, TextPrims and FacePrims, as I explained in a previous post about contour plots customization, two years ago.
Let’s start with a simple contour plot of the peaks function:

[X,Y,Z] = peaks;
[C,hContour] = contour(X,Y,Z, 'ShowText','on', 'LevelStep',1);

[X,Y,Z] = peaks; [C,hContour] = contour(X,Y,Z, 'ShowText','on', 'LevelStep',1);

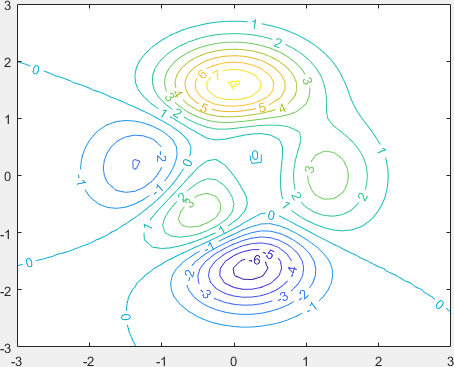
The result is the screenshot on the left:
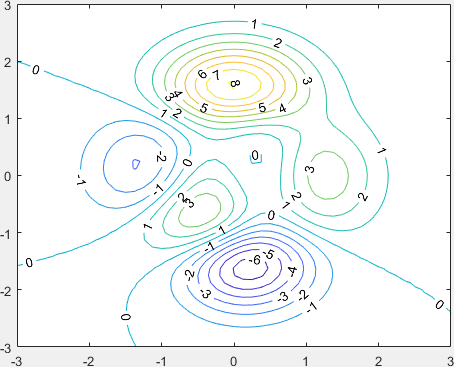
Standard Matlab contour labels
 
Customized Matlab contour labels

In order to update the label colors (to get the screenshot on the right), we create a short updateContours function that updates the TextPrims color to their corresponding EdgePrims color:

The updateContours() function

function updateContours(hContour)
    % Update the text label colors
    drawnow  % very important!
    levels = hContour.LevelList;
    labels = hContour.TextPrims;  % undocumented/unsupported
    lines  = hContour.EdgePrims;  % undocumented/unsupported
    for idx = 1 : numel(labels)
        labelValue = str2double(labels(idx).String);
        lineIdx = find(abs(levels-labelValue)<10*eps, 1);  % avoid FP errors using eps
        labels(idx).ColorData = lines(lineIdx).ColorData;  % update the label color
        %labels(idx).Font.Size = 8;                        % update the label font size
    end
    drawnow  % optional
end

function updateContours(hContour) % Update the text label colors drawnow % very important! levels = hContour.LevelList; labels = hContour.TextPrims; % undocumented/unsupported lines = hContour.EdgePrims; % undocumented/unsupported for idx = 1 : numel(labels) labelValue = str2double(labels(idx).String); lineIdx = find(abs(levels-labelValue)<10*eps, 1); % avoid FP errors using eps labels(idx).ColorData = lines(lineIdx).ColorData; % update the label color %labels(idx).Font.Size = 8; % update the label font size end drawnow % optional end

Note that in this function we don’t directly equate the numeric label values to the contour levels’ values: this would work well for integer values but would fail with floating-point ones. Instead I used a very small 10*eps tolerance in the numeric comparison.
Also note that I was careful to call drawnow at the top of the update function, in order to ensure that EdgePrims and TextPrims are updated when the function is called (this might not be the case before the call to drawnow). The final drawnow at the end of the function is optional: it is meant to reduce the flicker caused by the changing label colors, but it can be removed to improve the rendering performance in case of rapidly-changing contour plots.
Finally, note that I added a commented line that shows we can modify other label properties (in this case, the font size from 10 to 8). Feel free to experiment with other label properties.

Putting it all together

The final stage is to call our new updateContours function directly, immediately after creating the contour plot. We also want to call updateContours asynchronously whenever the contour is redrawn, for example, upon a zoom/pan event, or when one of the relevant contour properties (e.g., LevelStep or *Data) changes. To do this, we add a callback listener to the contour object’s [undocumented] MarkedClean event that reruns our updateContours function:

[X,Y,Z] = peaks;
[C,hContour] = contour(X,Y,Z, 'ShowText','on', 'LevelStep',1);
% Update the contours immediately, and also whenever the contour is redrawn
updateContours(hContour);
addlistener(hContour, 'MarkedClean', @(h,e)updateContours(hContour));

[X,Y,Z] = peaks; [C,hContour] = contour(X,Y,Z, 'ShowText','on', 'LevelStep',1); % Update the contours immediately, and also whenever the contour is redrawn updateContours(hContour); addlistener(hContour, 'MarkedClean', @(h,e)updateContours(hContour));

Contour level values

As noted in my comment reply below, the contour lines (hContour.EdgePrims) correspond to the contour levels (hContour.LevelList).
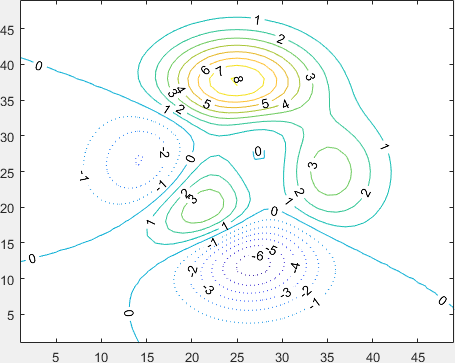
For example, to make all negative contour lines dotted, you can do the following:

[C,hContour] = contour(peaks, 'ShowText','on', 'LevelStep',1); drawnow
set(hContour.EdgePrims(hContour.LevelList<0), 'LineStyle', 'dotted');

[C,hContour] = contour(peaks, 'ShowText','on', 'LevelStep',1); drawnow set(hContour.EdgePrims(hContour.LevelList<0), 'LineStyle', 'dotted');

Customized Matlab contour lines

Prediction about forward compatibility

As I noted on my previous post on contour plot customization, I am marking this article as “High risk of breaking in future Matlab versions“, not because of the basic functionality (being important enough I don’t presume it will go away anytime soon) but because of the property names: TextPrims, EdgePrims and FacePrims don’t seem to be very user-friendly property names. So far MathWorks has been very diligent in making its object properties have meaningful names, and so I assume that when the time comes to expose these properties, they will be renamed (perhaps to TextHandles, EdgeHandles and FaceHandles, or perhaps LabelHandles, LineHandles and FillHandles). For this reason, even if you find out in some future Matlab release that TextPrims, EdgePrims and FacePrims don’t exist, perhaps they still exist and simply have different names. Note that these properties have not changed their names or functionality in the past 3 years, so while it could well happen next year, it could also remain unchanged for many years to come. The exact same thing can be said for the MarkedClean event.

Professional assistance anyone?

As shown by this and many other posts on this site, a polished interface and functionality is often composed of small professional touches, many of which are not exposed in the official Matlab documentation for various reasons. So if you need top-quality professional appearance/functionality in your Matlab program, or maybe just a Matlab program that is dependable, robust and highly-performant, consider employing my consulting services.

Related posts:

  1. Customizing contour plots – Contour labels, lines and fill patches can easily be customized in Matlab HG2. ...
  2. Customizing contour plots part 2 – The contour lines of 3D Matlab plot can be customized in many different ways. This is the 2nd article on this issue. ...
  3. Customizing histogram plots – Basic bar charts and histogram plots can be customized in important aspects. ...
  4. Customizing axes tick labels – Multiple customizations can be applied to tick labels. ...
  5. Customizing axes part 5 – origin crossover and labels – The axes rulers (axles) can be made to cross-over at any x,y location within the chart. ...
  6. Customizing uiundo – This article describes how Matlab's undocumented uiundo undo/redo manager can be customized...
Handle graphics HG2 Hidden property Pure Matlab
Print Print
« Previous
Next »
9 Responses
  1. Elbio November 17, 2017 at 00:02 Reply

    Hi Yair:

    Using the old matlab utilities it was possible to get the Cdata value associated with each line in the contour plot:

    [c,h]=contourf(peaks,[-9:1:9]);
    h1=get(h,'children');
    hdd=get(h1(1),'Cdata');
     
    hdd=8

    [c,h]=contourf(peaks,[-9:1:9]); h1=get(h,'children'); hdd=get(h1(1),'Cdata'); hdd=8

    This utility was useful to dash the negative contours of some plot. Apparently there is no “cdata” value in the h.EdgePrims properties.

    How do you think that one can proceed in order to get these values?

    Regards,

    Elbio

    • Yair Altman November 17, 2017 at 10:17 Reply

      @Elbio – in HG2 (R2014b or newer) the contour lines (hContour.EdgePrims) correspond to the contour levels (hContour.LevelList). For example, to make all negative contour lines dotted, you can do the following:

      [C,hContour] = contour(peaks, 'ShowText','on', 'LevelStep',1); drawnow
      set(hContour.EdgePrims(hContour.LevelList<0), 'LineStyle', 'dotted');

      [C,hContour] = contour(peaks, 'ShowText','on', 'LevelStep',1); drawnow set(hContour.EdgePrims(hContour.LevelList<0), 'LineStyle', 'dotted');

      I added an explanation and screenshot to the main article text above.

      • Elbio November 17, 2017 at 16:16

        Hi Yair:

        Many thanks for your helpful answer. I found a problem though when using contourf.

        [c,h] = contourf(peaks,'LevelStep',1); drawnow
        levels = h.LevelList;
        lines  = h.EdgePrims;
        set(lines(levels<0),  'LineStyle', 'dotted');
        set(lines(levels==0), 'LineWidth', 2);

        [c,h] = contourf(peaks,'LevelStep',1); drawnow levels = h.LevelList; lines = h.EdgePrims; set(lines(levels<0), 'LineStyle', 'dotted'); set(lines(levels==0), 'LineWidth', 2);

        Instead of highlighting the zero line it is the “1” line the one that appears wider.
        It might be related to the different size of the levels and lines arrays. For example if I tried to change the linestyle using:

        [c,h] = contourf(peaks,[-9:1:9]);
        levels = h.LevelList;
        lines  = h.EdgePrims;
        set(lines(levels<0), 'LineStyle', 'dotted');

        [c,h] = contourf(peaks,[-9:1:9]); levels = h.LevelList; lines = h.EdgePrims; set(lines(levels<0), 'LineStyle', 'dotted');

        there are dotted lines with positive values.

        Regards,
        Elbio.

      • Yair Altman November 18, 2017 at 17:57

        Unlike contour, the contourf function returns a list of levels that includes the minimum value, which does not correspond to any contour line ([-6.5466,-6,-5,-4,...] rather than [-6,-5,-4,...]). So the solution for contourf is simply to equate levels(2:end) with lines, as follows:

        [c,hContour] = contourf(peaks, 'LevelStep',1, 'ShowText','on'); drawnow
        levels = hContour.LevelList(2:end);
        lines  = hContour.EdgePrims;
        set(lines(levels<0),  'LineStyle', 'dotted');
        set(lines(levels==0), 'LineWidth', 2);

        [c,hContour] = contourf(peaks, 'LevelStep',1, 'ShowText','on'); drawnow levels = hContour.LevelList(2:end); lines = hContour.EdgePrims; set(lines(levels<0), 'LineStyle', 'dotted'); set(lines(levels==0), 'LineWidth', 2);

  2. Alon December 13, 2017 at 16:27 Reply

    Hello Yair,
    Note that if there are unused contour lines, as may be the case when hContour.LevelListMode is set to manual, the above code will not work, as hContour.EdgePrims enumerates only the visible contour lines (while not hinting at the contour level they are related to), while hContour.LevelList enumerates them all.
    Instead, you must enumerate the visible contour lines:

    k = 1;
    activecontours = [];
    while k < size(hContour.ContourMatrix,2)
        activecontours = [activecontours hContour.ContourMatrix(1,k)];
        k = k + hContour.ContourMatrix(2,k) + 1;
    end
    levels = unique(activecontours);

    k = 1; activecontours = []; while k < size(hContour.ContourMatrix,2) activecontours = [activecontours hContour.ContourMatrix(1,k)]; k = k + hContour.ContourMatrix(2,k) + 1; end levels = unique(activecontours);

    Then use the levels generated in the code you supplied.

    Best regards,
    Alon

    • Peter Cook December 16, 2017 at 00:08 Reply

      @Alon
      This method runs very slow for a complex contour (e.g. not necessarily in size but perhaps one generated from real, noisy, data), which led me to experiment with some other methods. In the case where contour levels are specified to the function, I found a heuristic that seems to work:

      [c,hContour] = contourf(imgaussfilt(noisyData,2),contourLevels);
      hL = hContour.EdgePrims;
      whichLevels = sum(bsxfun(@eq,c(1,:)',contourLevels)) > 10;
       
      >> length(contourLevels)
      ans =
          32
       
      >> length(hL)
      ans =
          24
       
      >> length(contourLevels(whichLevels))
      ans =
          24

      [c,hContour] = contourf(imgaussfilt(noisyData,2),contourLevels); hL = hContour.EdgePrims; whichLevels = sum(bsxfun(@eq,c(1,:)',contourLevels)) > 10; >> length(contourLevels) ans = 32 >> length(hL) ans = 24 >> length(contourLevels(whichLevels)) ans = 24

      I’m sure this might fail on some other contour plots, but it has worked on several I generated. Thoughts?

  3. Steve November 7, 2018 at 11:16 Reply

    You can also use clabel(c,hContour,'FontSize',10,'Color',[1 1 1])

  4. Shan March 26, 2019 at 15:59 Reply

    Hi,
    Thank you so much for this improvement.
    But when I use the function ax=gca, it will overrun the set(hContour.EdgePrims(hContour.LevelList<0),'LineStyle','dotted');
    here is my code:

    [X,Y,Z] = peaks;
    [C,hContour] = contour(peaks,[-8 -6 -4 -2 -0 2 4 6 8], 'ShowText','on'); drawnow
    set(hContour.EdgePrims(hContour.LevelList<0),'LineStyle','dotted');
    ax=gca;
    ax.YDir = 'reverse';

    [X,Y,Z] = peaks; [C,hContour] = contour(peaks,[-8 -6 -4 -2 -0 2 4 6 8], 'ShowText','on'); drawnow set(hContour.EdgePrims(hContour.LevelList<0),'LineStyle','dotted'); ax=gca; ax.YDir = 'reverse';

    So do you have any solution for this?
    Thanks

    • Yair Altman March 29, 2019 at 16:26 Reply

      @Shan – The ax.YDir='reverse' command, and any other similar command that repaints the axes, reverts the EdgePrims to their default (documented) behavior. So after any such command, you need to redo the setting of the undocumented functionality (set(hContour.EdgePrims...)

Leave a Reply
HTML tags such as <b> or <i> are accepted.
Wrap code fragments inside <pre lang="matlab"> tags, like this:
<pre lang="matlab">
a = magic(3);
disp(sum(a))
</pre>
I reserve the right to edit/delete comments (read the site policies).
Not all comments will be answered. You can always email me (altmany at gmail) for private consulting.

Click here to cancel reply.

Useful links
  •  Email Yair Altman
  •  Subscribe to new posts (email)
  •  Subscribe to new posts (feed)
  •  Subscribe to new posts (reader)
  •  Subscribe to comments (feed)
 
Accelerating MATLAB Performance book
Recent Posts

Speeding-up builtin Matlab functions – part 3

Improving graphics interactivity

Interesting Matlab puzzle – analysis

Interesting Matlab puzzle

Undocumented plot marker types

Matlab toolstrip – part 9 (popup figures)

Matlab toolstrip – part 8 (galleries)

Matlab toolstrip – part 7 (selection controls)

Matlab toolstrip – part 6 (complex controls)

Matlab toolstrip – part 5 (icons)

Matlab toolstrip – part 4 (control customization)

Reverting axes controls in figure toolbar

Matlab toolstrip – part 3 (basic customization)

Matlab toolstrip – part 2 (ToolGroup App)

Matlab toolstrip – part 1

Categories
  • Desktop (45)
  • Figure window (59)
  • Guest bloggers (65)
  • GUI (165)
  • Handle graphics (84)
  • Hidden property (42)
  • Icons (15)
  • Java (174)
  • Listeners (22)
  • Memory (16)
  • Mex (13)
  • Presumed future risk (394)
    • High risk of breaking in future versions (100)
    • Low risk of breaking in future versions (160)
    • Medium risk of breaking in future versions (136)
  • Public presentation (6)
  • Semi-documented feature (10)
  • Semi-documented function (35)
  • Stock Matlab function (140)
  • Toolbox (10)
  • UI controls (52)
  • Uncategorized (13)
  • Undocumented feature (217)
  • Undocumented function (37)
Tags
ActiveX (6) AppDesigner (9) Callbacks (31) Compiler (10) Desktop (38) Donn Shull (10) Editor (8) Figure (19) FindJObj (27) GUI (141) GUIDE (8) Handle graphics (78) HG2 (34) Hidden property (51) HTML (26) Icons (9) Internal component (39) Java (178) JavaFrame (20) JIDE (19) JMI (8) Listener (17) Malcolm Lidierth (8) MCOS (11) Memory (13) Menubar (9) Mex (14) Optical illusion (11) Performance (78) Profiler (9) Pure Matlab (187) schema (7) schema.class (8) schema.prop (18) Semi-documented feature (6) Semi-documented function (33) Toolbar (14) Toolstrip (13) uicontrol (37) uifigure (8) UIInspect (12) uitools (20) Undocumented feature (187) Undocumented function (37) Undocumented property (20)
Recent Comments
  • Jianfei (30 days 20 hours ago): I have tried the MathWorks CheckBoxList in Matlab 2015b. For whatever the reason, I can’t change the font properties. I can change the font color, but changing font properties...
  • Donato Coppola (36 days 15 hours ago): Hi Yair, I have a problem with the double format. When I run the treeTable function, the numbers in double format cells are displayed with comma as decimal separator. How can...
  • Kim (42 days 5 hours ago): Yair, the following didn’t work for me either: jh.setBorderPainted(false); Regards, Kim
  • Adil (44 days 7 hours ago): Thank you for the blog, it was useful for me. I have a file named App_project.mlapp.zip and when I extract it through Winzip it gives all the files exactly as you described above. I...
  • Mr Ashley Trowell (46 days 17 hours ago): Thank you so much for this analysis. Also, I find it somewhat horrifying. The take away seems to be to use && / || and NOT and / or. Thanks a bunch! ~Ashley
  • Matt (51 days 18 hours ago): Late reply I know, but you can call custom shortcuts with alt-#. Hold down Alt to see what number is assigned to the shortcuts you’ve created. Now if there was a way to create a...
  • James (59 days 13 hours ago): Is there a way to change the location of the window? They pop up at random locations and the user has to chase them down.
  • Robin (59 days 21 hours ago): Hi Yair, This has been a great help. With the removal of com.mathworks sometime in the future (as announced in R2020b), is there an alternative? For me, just getting a preference...
  • Eric Dziekonski (81 days 19 hours ago): This is fantastic! Thanks everyone! To get access to CEF on 2019b, I had to take the advise of Jeffery Devereux and Xiangrui Li. warning off MATLAB:structOnObject % suppress...
  • Yair Altman (82 days 1 hour ago): jPanel1.setParent(jPanel2) will reparent jPanel1 (and similarly any Java component/container) inside jPanel2 (any Java container). While this might work, it seems to me to be an...
  • Eivind (82 days 15 hours ago): Hi, Thanks for a great function! I was trying to put the main panel of my figure into a scrollable panel with the goal of zooming into the panel using shift+scroll and scrolling up...
  • Yair Altman (97 days 2 hours ago): There is no direct way to replicate the CW in a GUI window, you’ll need to display the text in the GUI using your program logic. Here is one possible implementation that...
  • Sunki Reddy Gunugu (98 days 23 hours ago): hi 1.i would like to know how the error in command window of matlab is captured and displayed in the GUI with the same color in CW 2. Is their any way to replicate the...
  • Matthias Brenneis (101 days 18 hours ago): Hi, thank you so much for the inspiring work and comments! My issue is: As soon as the panel gets an axes, the panel is no longer transparent: f =...
  • Collin (121 days 15 hours ago): Yair, In 2020a Mathworks added this semi-useful class matlab.ui.internal.JavaMigrati onTools Which contains static methods to call javacomponent, actxcontrol or to get an...
Contact us
Undocumented Matlab © 2009 - Yair Altman
Scroll to top