Undocumented Matlab
  • SERVICES
    • Consulting
    • Development
    • Training
    • Gallery
    • Testimonials
  • PRODUCTS
    • IQML: IQFeed-Matlab connector
    • IB-Matlab: InteractiveBrokers-Matlab connector
    • EODML: EODHistoricalData-Matlab connector
    • Webinars
  • BOOKS
    • Secrets of MATLAB-Java Programming
    • Accelerating MATLAB Performance
    • MATLAB Succinctly
  • ARTICLES
  • ABOUT
    • Policies
  • CONTACT

Customizing contour plots part 2

March 9, 2016 5 Comments

A few months ago I discussed various undocumented manners by which we can customize Matlab contour plots. A short while ago I receive an email from a blog reader (thanks Frank!) alerting me to another interesting way by which we can customize such plots, using the contour handle’s hidden ContourZLevel property. In today’s post I will explain how we can use this property and expand the discussion with some visualization interactivity.

The ContourZLevel property

The contour handle’s ContourZLevel property is a hidden property. This means that, just like all other hidden properties, it is accessible if we just happen to know its name (which is easy using my getundoc utility). This property sets the Z level at which the contour lines are drawn.
For example, by default the meshc function sets ContourZLevel‘s value to the bottom of the 3D display (in other words, to the axes’ ZLim(1) value). This is done within the mesh.m function:
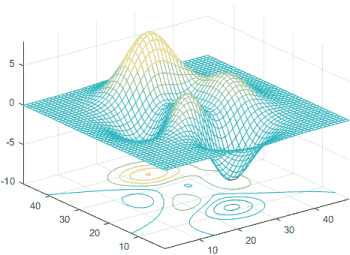
Standard Matlab meshc output (contour at bottom)

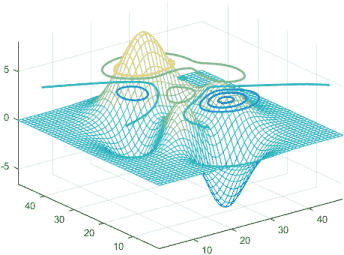
We can, however, modify the contour’s level value to any other Z location:

% create a mesh and contour plot
handles = meshc(peaks);
% handles is a 2-element array of handles: the surface plot and the contours
hContour = handles(2); % get the handle to the contour lines
hContour.ContourZLevel = 4.5; % set the contour's Z position (default: hAxes.ZLim(1)=-10)
% We can also customize other aspects of the contour lines, for example:
hContour.LineWidth = 2; % set the contour lines' width (default: 0.5)

% create a mesh and contour plot handles = meshc(peaks); % handles is a 2-element array of handles: the surface plot and the contours hContour = handles(2); % get the handle to the contour lines hContour.ContourZLevel = 4.5; % set the contour's Z position (default: hAxes.ZLim(1)=-10) % We can also customize other aspects of the contour lines, for example: hContour.LineWidth = 2; % set the contour lines' width (default: 0.5)

Customized Matlab meshc output

Adding some visualization interactivity

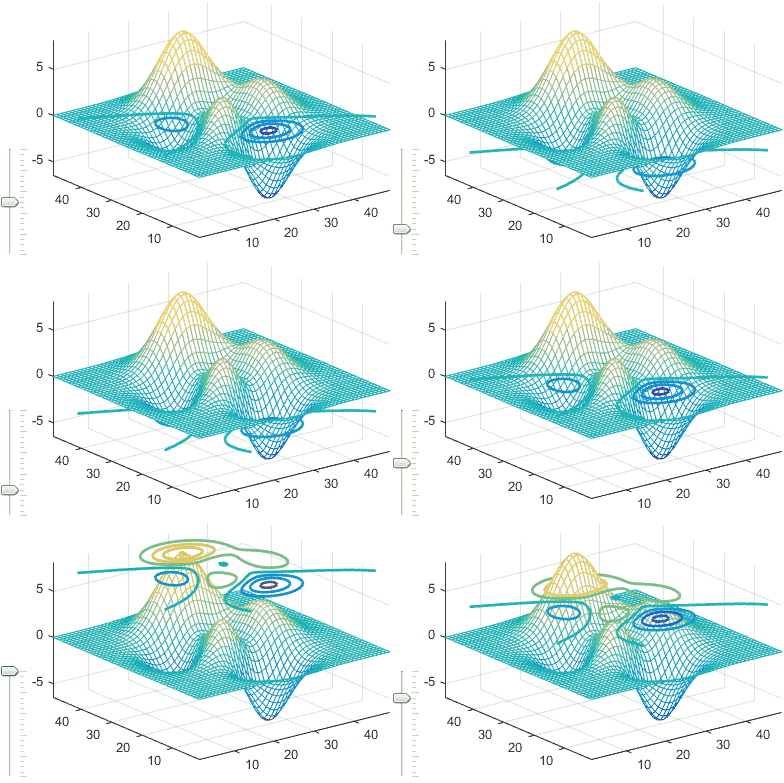
Now let’s add some fun interactivity using a vertical slider to control the contour’s height (Z level). Matlab’s slider uicontrol is really just an ugly scrollbar, so we’ll use a Java JSlider instead:

% Add a controlling slider to the figure
jSlider = javaObjectEDT(javax.swing.JSlider);
jSlider.setOrientation(jSlider.VERTICAL);
jSlider.setPaintTicks(true);
jSlider.setMajorTickSpacing(20);
jSlider.setMinorTickSpacing(5);
jSlider.setBackground(java.awt.Color.white);
[hjSlider, hContainer] = javacomponent(jSlider, [10,10,30,120], gcf);
% Set the slider's action callback
hAxes = hContour.Parent;  % handle to containing axes
zmin = hAxes.ZLim(1);
zmax = hAxes.ZLim(2);
zrange = zmax - zmin;
cbFunc = @(hSlider,evtData) set(hContour,'ContourZLevel',hSlider.getValue/100*zrange+zmin);
hjSlider.StateChangedCallback = cbFunc;  % set the callback for slider action events
cbFunc(hjSlider,[]);  % evaluate the callback to synchronize the initial display

% Add a controlling slider to the figure jSlider = javaObjectEDT(javax.swing.JSlider); jSlider.setOrientation(jSlider.VERTICAL); jSlider.setPaintTicks(true); jSlider.setMajorTickSpacing(20); jSlider.setMinorTickSpacing(5); jSlider.setBackground(java.awt.Color.white); [hjSlider, hContainer] = javacomponent(jSlider, [10,10,30,120], gcf); % Set the slider's action callback hAxes = hContour.Parent; % handle to containing axes zmin = hAxes.ZLim(1); zmax = hAxes.ZLim(2); zrange = zmax - zmin; cbFunc = @(hSlider,evtData) set(hContour,'ContourZLevel',hSlider.getValue/100*zrange+zmin); hjSlider.StateChangedCallback = cbFunc; % set the callback for slider action events cbFunc(hjSlider,[]); % evaluate the callback to synchronize the initial display

Interactive contour height

Related posts:

  1. Customizing contour plots part 2 – Matlab contour labels' color and font can easily be customized. ...
  2. Customizing contour plots – Contour labels, lines and fill patches can easily be customized in Matlab HG2. ...
  3. Customizing histogram plots – Basic bar charts and histogram plots can be customized in important aspects. ...
  4. Customizing figure toolbar background – Setting the figure toolbar's background color can easily be done using just a tiny bit of Java magic powder. This article explains how. ...
  5. Customizing axes part 3 – Backdrop – Matlab HG2 axes can be customized in many different ways. This article explains some of the undocumented aspects. ...
  6. Customizing uiundo – This article describes how Matlab's undocumented uiundo undo/redo manager can be customized...
HG2 Java Pure Matlab Undocumented property
Print Print
« Previous
Next »
5 Responses
  1. Kerem March 27, 2016 at 11:42 Reply

    Hello,
    Why do I get an error
    “??? Reference to non-existent field ‘Parent’.” hCountour is defined in the first code part you gave.
    I simply copy and past two fields.

    • Yair Altman March 27, 2016 at 18:58 Reply

      @Kerem – you did not copy properly. It is hContour, not hCountour. As to why the Parent field does not exist, perhaps you are using an old Matlab version (HG1, R2014a or older).

  2. Mark April 11, 2016 at 23:12 Reply

    I displace the contour plane using the documented feature hgtransform.

    % get empty identity transform
    hT = hgtransform; 
    % create transform matrix for z-distance zDisplace
    hT.Matrix = makehgtform('translate',[0 0 zDisplace]); 
    % Transform Parent
    hContour.Parent = hT;

    % get empty identity transform hT = hgtransform; % create transform matrix for z-distance zDisplace hT.Matrix = makehgtform('translate',[0 0 zDisplace]); % Transform Parent hContour.Parent = hT;

  3. RicardoMBorges June 19, 2017 at 15:39 Reply

    Hello. Thanks for this.
    I’m looking for a way to add this scroll bar but using Level as action. I want to mess around with the cutting level of a contour plot interactively.
    Thanks for any help.

    • Yair Altman July 16, 2017 at 00:13 Reply

      @Ricardo – I don’t quite understand what you need. In general, if you want to change the action of the slider then simply update its callback function:

      cbFunc = @(hSlider,evtData) set(hContour,'ContourZLevel',hSlider.getValue/100*zrange+zmin);

      cbFunc = @(hSlider,evtData) set(hContour,'ContourZLevel',hSlider.getValue/100*zrange+zmin);

  4. Indira X October 10, 2019 at 10:29 Reply

    Hello,
    I use “surf” with x and y as vectors, and z as matrix. I want to move the contours at 59.7 in z, so I wrote this:

    handles = meshc(z);
    hContour = handles(2);
    hContour.ContourZLevel = 59.5;

    handles = meshc(z); hContour = handles(2); hContour.ContourZLevel = 59.5;

    I don’t see the contours, instead I see a small “bar” along z axis.

    May you please give me a hint?

    Thanks in advance.

Leave a Reply
HTML tags such as <b> or <i> are accepted.
Wrap code fragments inside <pre lang="matlab"> tags, like this:
<pre lang="matlab">
a = magic(3);
disp(sum(a))
</pre>
I reserve the right to edit/delete comments (read the site policies).
Not all comments will be answered. You can always email me (altmany at gmail) for private consulting.

Click here to cancel reply.

Useful links
  •  Email Yair Altman
  •  Subscribe to new posts (email)
  •  Subscribe to new posts (feed)
  •  Subscribe to new posts (reader)
  •  Subscribe to comments (feed)
 
Accelerating MATLAB Performance book
Recent Posts

Speeding-up builtin Matlab functions – part 3

Improving graphics interactivity

Interesting Matlab puzzle – analysis

Interesting Matlab puzzle

Undocumented plot marker types

Matlab toolstrip – part 9 (popup figures)

Matlab toolstrip – part 8 (galleries)

Matlab toolstrip – part 7 (selection controls)

Matlab toolstrip – part 6 (complex controls)

Matlab toolstrip – part 5 (icons)

Matlab toolstrip – part 4 (control customization)

Reverting axes controls in figure toolbar

Matlab toolstrip – part 3 (basic customization)

Matlab toolstrip – part 2 (ToolGroup App)

Matlab toolstrip – part 1

Categories
  • Desktop (45)
  • Figure window (59)
  • Guest bloggers (65)
  • GUI (165)
  • Handle graphics (84)
  • Hidden property (42)
  • Icons (15)
  • Java (174)
  • Listeners (22)
  • Memory (16)
  • Mex (13)
  • Presumed future risk (394)
    • High risk of breaking in future versions (100)
    • Low risk of breaking in future versions (160)
    • Medium risk of breaking in future versions (136)
  • Public presentation (6)
  • Semi-documented feature (10)
  • Semi-documented function (35)
  • Stock Matlab function (140)
  • Toolbox (10)
  • UI controls (52)
  • Uncategorized (13)
  • Undocumented feature (217)
  • Undocumented function (37)
Tags
ActiveX (6) AppDesigner (9) Callbacks (31) Compiler (10) Desktop (38) Donn Shull (10) Editor (8) Figure (19) FindJObj (27) GUI (141) GUIDE (8) Handle graphics (78) HG2 (34) Hidden property (51) HTML (26) Icons (9) Internal component (39) Java (178) JavaFrame (20) JIDE (19) JMI (8) Listener (17) Malcolm Lidierth (8) MCOS (11) Memory (13) Menubar (9) Mex (14) Optical illusion (11) Performance (78) Profiler (9) Pure Matlab (187) schema (7) schema.class (8) schema.prop (18) Semi-documented feature (6) Semi-documented function (33) Toolbar (14) Toolstrip (13) uicontrol (37) uifigure (8) UIInspect (12) uitools (20) Undocumented feature (187) Undocumented function (37) Undocumented property (20)
Recent Comments
  • JCFL (1 day 0 hours ago): I was trying the above trick to change the transparency of contour lines and wondering why not all the lines have changed — then I found your post. Thanks and your post saved me.
  • Patrick Fitzgerald (3 days 3 hours ago): Just a heads up to anyone else digging around for help related to this: if you assign BackrgoundColor to a pushbutton-style uicontrol, it seems to prevent you from...
  • Vasiliy (18 days 23 hours ago): Hi Yair, i’m trying to use the MonthChooserPanel class. com.mathworks.mwswing.MJUtilit ies.initJIDE; handles.jPanel = com.jidesoft.combobox.MonthCho oserPanel;...
  • DM (18 days 23 hours ago): Hi Yair, I’m trying to use the MonthChooserPanel class. com.mathworks.mwswing.MJUtilit ies.initJIDE; handles.jPanel = com.jidesoft.combobox.MonthCho oserPanel; [handles.hPanel,...
  • Yair Altman (22 days 15 hours ago): @Alex – thanks, but keep in mind that new functions will only work on the recent Matlab releases. If your code needs to work on older Matlab releases, you could revert to...
  • Alex Churchill (22 days 16 hours ago): I was looking up how to do this exact task today. I was about to hold my nose and use the internal controllib function, when I happened to chance across a slightly newer...
  • Sebastian Hölz (28 days 22 hours ago): I have not investigated this in detail, but I think one way to go in new versions of Matlab (>2019b) might be to use listeners to suitable figure properties, e.g. fig =...
  • Prathep (29 days 1 hour ago): Hi Yair, Thanks for your introduction on Matlab Toostrip. Is there any way to add Matlab toolstrip for uifigures as you have done already for figure?
  • Josh (35 days 7 hours ago): Dear Yair, Small typo; you wrote >>Move lines up or down – CTRL + ALT + UP or DOWN allows you to move selected lines up or down but it’s actually ALT+SHIFT then UP/DOWN...
  • Yair Altman (42 days 2 hours ago): You can try to increase the Java heap memory size in the Matlab preferences (General => Java Heap Memory). Any changes to the settings will only take effect after restarting...
  • Thomas (42 days 3 hours ago): Hello, thanks for sharing! I currently receive the following memory error message when using savezip with a big object (Matlab R2020b, Windows 10). Error using...
  • Yair Altman (45 days 11 hours ago): Yerlan – either use menuItem1.setEnabled(0) or set(menuItem1,'Enabled',0)
  • Manzn (45 days 13 hours ago): Thank you man! you saved me, when there was no more light 😀
  • Yerlan (46 days 18 hours ago): Hello Mr. Altman, how can I disable menu items in the context menu? E.g. when I am trying to do this: menuItems = jmenu.getSubElements; menuItem1 = menuItems(1);...
  • Yair Altman (47 days 10 hours ago): Thanks for the note Eric – you forgot the crucial call to jTable.setLabelTable(labelTabl e) – I added it into your code snippet above.
Contact us
Undocumented Matlab © 2009 - Yair Altman
Scroll to top