When designing Matlab applications, we can either use Matlab’s designer (guide), or manually position each GUI component programmatically, using its Position property. Matlab lacks the layout managers so common in Java, that enable easy relative component positioning, taking into account dynamic container size, components spacing weights etc. Of course, we can always trap the container’s ResizeFcn callback to update our layout, but doing so is one royal pain in the so-and-so…
Luckily, there is (of course) an undocumented solution to this problem, and at the public’s demand I will detail it below. It doesn’t solve all layout-management needs, but it goes a long way. Most importantly, it uses pure Matlab – no Java knowledge whatsoever is needed.
uicontainer
Matlab’s uicontainer family (uicontainer, uiflowcontainer and uigridcontainer) consists of container objects that enable customizable layout management of contained components. Uicontainers can contain any Matlab component that may have a uipanel handle as a Parent property. This includes uicontrols, plot axes etc., as well as other uicontainers.
The basic uicontainer object appears to be little more than a transparent container for contained objects. It can be used interchangeably with uipanel, which appears to be a specialized type of a uicontainer. Indeed, as MathWorks notes:
The UICONTAINER function is undocumented, and is not intended for direct use. The UIPANEL function should be used instead, as it provides more functionality.
In some cases, Matlab itself uses uicontainer instead of uipanel: for example, ActiveX controls are enclosed within transparent uicontrol objects when added to a figure:
>> [hActivex,hContainer] = actxcontrol('OWC11.Spreadsheet.11'); >> get(hContainer,'Type') ans = uicontainer |
uicontainer objects are not very customizable. For example, unlike uipanels, uicontainers have no titles or borders. We would therefore usually prefer to use uipanels, as Mathworks suggested above. An exception to this rule is a case where we need to derive our own customized container class. An example of this is found in %matlabroot%/toolbox/matlab/uitools/@uitools/@uitab/schema.m, which derives uicontainer to create a uitab container (which will be described in a future article).
Relatives of uicontainer are more useful in general: uiflowcontainers and uigridcontainers act similarly to Java’s layout managers – specifically, FlowLayout and GridLayout. I expect to see additional layout managers incarnated within Matlab uicontainers in future Matlab versions (perhaps in the R2010b pre-release that came out today – I can’t wait to see…).
uiflowcontainer
uiflowcontainer is a uicontainer that enables adding uicontrols to the container without specifying an exact position as would be required for uicontainer or uipanel (actually, positions may be specified, but they are simply ignored).
By default, objects are added from the top-left corner, depending on the uiflowcontainer‘s available space and dimensions: if width > height then rightward, otherwise downward. If the container’s dimensions change, for example by resizing the figure window, then the container’s components will automatically be resized accordingly:
hc = uiflowcontainer('Units','norm','Position',[.1,.1,.8,.8]); h1 = uicontrol('string','1','parent',hc); h2 = uicontrol('string','2','parent',hc); h3 = uicontrol('string','3','parent',hc); |
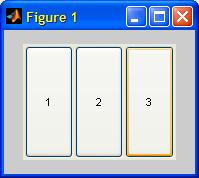
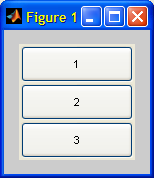
The components flow direction within the container may be modified by setting the uiflowcontainer‘s FlowDirection property from its default value of ‘Auto’ to ‘AutoReverse’, ‘BottomUp’, ‘TopDown’, ‘LeftToRight’, or ‘RightToLeft’:
set(hc,'FlowDirection','BottomUp') set(hc,'FlowDirection','RightToLeft') |
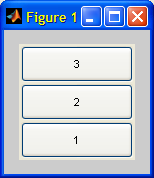
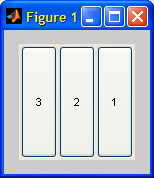
Spacing between the components and the container’s border, and between themselves, may be controlled via the Margin property. By default, Margin is set to 2 (pixels):

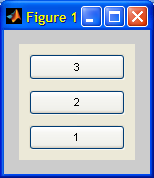
The advantage of using uiflowcontainer is its automatic resizing and positioning of components. Notice how we simply specified the uiflowcontainer‘s handle as the control’s parent, and got all this functionality out-of-the-box!
If we need to use fixed-dimensions components, we can use uicontrol‘s undocumented properties HeightLimits and WidthLimits, each of which is a 2-element numeric vector specifying the minimal and maximal allowed value for the height or width (both of these vectors are [2,Inf] by default). uiflowcontainer tries to accommodate the requested limits by stretching or compressing its components (we need to resize the figure for the component resizing to become visible):
set(h1, 'HeightLimits',[10,20], 'WidthLimits',[30,30]) set(h2, 'HeightLimits',[50,50]) set(h3, 'HeightLimits',[2,inf]) % =default value |
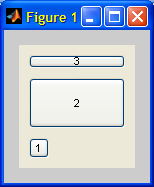
Sometimes, however, no amount of component resizing is enough to fully contain all components within the uiflowcontainer:
set(h2, 'WidthLimits',[150,150]) set(h3, 'HeightLimits',[50,50]) % resize figure to see effect |
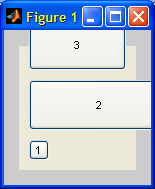
Note: uiflowcontainer normally ignores the specified limits if they would cause the component to stretch beyond the container boundaries. This happens unless the limits are identical (as in the preceding example), which informs uiflowcontainer that it has no judgment in the component’s dimensions.
In more complex cases, consider coding your own customized class deriving from uiflowcontainer. An example for such a customization can be seen in %matlabroot%/toolbox/matlab/uitools/@uitools/@uitabgroup/schema.m, which derives uiflowcontainer to create a uitabgroup container.
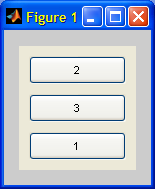
Components within a uiflowcontainer are ordered according to the order they were added to the container. This order can be modified by rearranging the handles in the container’s Children property, or by using the uistack function which does the same. Note that a side-effect of this is that the components dimensions are re-normalized:
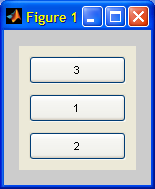
uigridcontainer
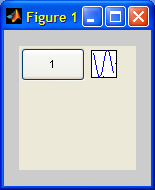
uigridcontainer is similar to uiflowcontainer in its specialization of the layout: in this case, the container is divided into a transparent grid of N-by-M cells (1×1 by default), each of which can contain its own component:
hc = uigridcontainer('Units','norm','Position',[.1,.1,.8,.8]); set(hc, 'GridSize',[2,3]); % default GridSize is [1,1] h1 = uicontrol('string','1','parent',hc); h2 = uicontrol('string','2','parent',hc); h3 = uicontrol('string','3','parent',hc); h4 = axes('parent',hc); x = -4:.1:4; plot(h4,x,sin(x)); set(h4,'YTickLabel',[],'XTickLabel',[]); |
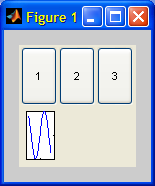
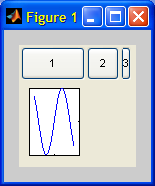
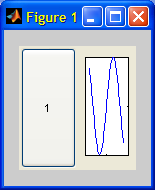
The grid cells relative size can be controlled via the HorizontalWeight and VerticalWeight properties (set to NaN by default). These properties should be a numeric vector the same size as the corresponding number of cells. The property values are not important – only their relative values are used to control the relative cell dimensions. The EliminateEmptySpace property (default=’off’) controls whether empty grid rows/columns are eliminated from the container or displayed. As in uiflowcontainers, the Margin property controls the spacing between the internal components and borders:
set(hc, 'HorizontalWeight',[6,3,1], 'VerticalWeight',[0.2,0.5]) delete([h2,h3]); % only h1,h4 remain set(hc,'EliminateEmptySpace','on') |
Other layout alternatives
Brad Phelan of XTargets has created Matlab equivalents of Java’s BorderLayout and SpringLayout. The advantage of using Brad’s layout managers is that they appear to have full Matlab interoperability, including the ability to add Matlab components, unlike Java’s layout managers.
A File Exchange contributor named Jason has added a GridBagLayout implementation, mimicking Java’s well-known GridBagLayout.
Additional and more flexible layout managers are available in Java (one of my favorites is JGoodies Forms, which is pre-bundled with Matlab). Just remember the limitation that no Matlab component (such as GUI controls or plot axes) can be added to Java containers. Therefore, feel free to use these Java containers as long as their contained GUI is limited to Java components (JButton, JComboBox etc.).
Other uitools
Today’s article about uicontainer and its relatives was the first of several posts that will describe undocumented functions that reside in the %matlabroot%/toolbox/matlab/uitools folder. Feel free to look within this folder for other interesting undocumented functions. Most of these functions are semi-documented, meaning that they have a usable help-section hidden within the m-file (type “edit uicontainer.m” for example). Many have existed more-or-less unchanged for many releases. Note that there is no guarantee that they will remain in future releases. When using unsupported functionality, always code defensively.


Thank you Yair for this blog and this post. I really appreciate the insight.
You don’t mention the GUI Layout Toolbox that appeared on the File Exchange last month. It seems to share ancestors with Brad Phelan’s layout managers. Brad, who once worked for The Mathworks, is acknowledged.
GUI Layout Toolbox
by Ben Tordoff
(The Mathworks)
/ per
@per – my bad for the oversight – thanks for pointing it out. The GUI Layout Toolbox is indeed an excellent utility. Funny it was published only two weeks ago and I missed it…
Hi Sir,
I am a beginner in Matlab. I have saved data from the workspace into a mat file. It consists of vectors of sizes 82×3 , 32×1 … Now I intend to print it out in the form of a table. Should I convert it to excel? How should I create tables from workspace data(in the form of mat files)? Awaiting your reply.
@Chaitanya – you can use the uitable function to display and print data in table format in Matlab. uitable was undocumented (but available) until R2008a.
Alternately, you can display your data in the Variable (Array) Editor, using the openvar function:
[…] the returned uitabgroup object hTabGroup is actually a Matlab container (deriving from uiflowcontainer) that always displays two elements: the Java tab-group, and the active Matlab uicontainer […]
Yair, thank you for your blog. It’s very useful!
When did the Height/WidthLimits property appeared? It doesn’t seem to work in R2007b. What I get is:
??? Error using ==> set

There is no 'HeightLimits ' property in the 'uicontrol' class.
Thank you
Sim
Never mind, I just noticed that the container needed to be a uiflowcontainer. uigridcontainer does not enable the ‘HeightLimits‘ hidden property.
Sim
Well, disregard again, the error disappeared because I commented my line of code. So I still have the problem. Anyways, here’s what uiflowcontainer.m tells about these hidden properties
Which is what I’m doing, but without success with R2007b.
@Simon – I’m not sure why it’s not working for you. It does work fine on my Matlab R2007b on a Windows XP platform:
From your quoted error message above, I see that you called the property ‘HeightLimits ‘ (with an extra space) – perhaps this is the problem?
My error was to set the HeightLimits property at uicontrol creation, instead of using a separate set(‘HeightLimits’).
Thanks!
Simon
A little heads-up for using the uiflowcontainer object.
When the container is copied using copyobj, the WidthLimits and HeightLimits properties of its children are not copied.
And MathWorks, why oh why do you not have these limits properties implemented for uigridcontainer children??? I hope they have it on the to-do list…
Hi,
these containers are great.
One issue I’m having though is that patch objects (as e.g. used by a bar-plot) seem to have problems, when drawn in an axes which has a flow/gridcontainer as parent.
After zooming the axis, the patch-graphics which is not in the zoomed axis-range any more keeps being drawn outside the axis-area.
Surface-plots on the other hand seem to be ok…
This is in R2011b.
Has anybody else come across this problem?
It would be great if there’s a workaround…
ps:
Here’s a minimalistic example demonstrating the problem:
Hello, quick question on uipanels/button groups, how can i make one item (a radio button) with in the uipanel visible/not visible…
the code “set(handles.uibatspanel,’visible’,’off’)” makes the panel itself visible or not, but i want the radio button “raido2bats” within this panel to be visiable/not visiable
Many Thanks
Ben
Hi @Yair,
Thank you for the enlightening article; I find these functions extremely useful (just the freedom of not using the
'Position'property in each control saves me a huge load of time and effort). However I find them lacking in one tiny aspect:What I need is something like a
uiflowpanelfunction; i.e., having theuiflowcontainerwith theuipanel‘s frame and title — all in one handle-graphics object. To be more precise, I want an object, such that if Iset(...)a property or useinspect(...)it, I would see all the properties of theuipaneland theuiflowcontainertogether (same request extends naturally foruigridcontainer).Currently I use a nested object scheme:
but I wish for a more robust solution. I thought of combining two UDD classes (via inheritance or any other method), but I am not quite sure how to do it. Can you help?
Kind regards,
Yaroslav
@Yaroslav – take a look at my uicomponent utility and how it adds properties to existing UDD handles via the schema.prop function.
Note that unfortunately this feature is no longer available in the upcoming HG2.
For more information on UDD inheritance, read this.
The problem with adding properties to existing UDD handles, is that one must redefine all the new properties; I want to merge two UDD classes (double inheritance, etc.). Is it possible?
I am not aware of the ability to inherit multiple UDD superclasses, but this is not the same as saying that it’s not possible. Perhaps Donn Shull knows how to do it. I’d start looking in Donn’s article on UDD inheritance.
In uicomponent I wanted to merge the properties of the Java object and the Matlab container. So I took one of them and simply added to it (dynamically, using schema.prop) the properties of the other. Whenever I added such a dynamic property, I also overrode the new property’s set method and added handle.listeners, so that the original and the new properties would be linked, such that modifying any of them in run-time would automatically update the other. All this is done in a loop over the properties, so it is quite efficient and generic. Look at the source code of uicomponent for details – it’s well documented.
[…] exact, MATLAB has some undocumented plans managers: uiflowcontainer and uigridcontainer. See this article by Yair […]
[…] while researching UI layout techniques for programmatic GUI creation one of their articles made mention of this uiflowcontainer, which if you get the documentation on it you find it is undocumented. […]
Is there a way to specify a minimum height or width of uigridcontainer?
You can use the GridSize and Position properties (default values =
[1,1]and[0,0,1,1]meaning 100% in both directions, when Units='normalized')Hi Yair,
Isn’t this statement incorrect?
You cannot add axes, but you can manage a mixture of java components and uicontrols using swing layout mangers. You just need to add the corresponding java handles of uicontrol objects to your java container.
E.g. here’s an example applying a BoxLayout with a horizontal glue to a couple of uicontrol buttons:
I don’t really see much point using uiflowcontainer and alike. GUI Layout toolbox is perfect for most of the tasks, and when you need a fine-grained control of uicontrol, layout you can use the technique above (mixing them with java components if required).
@nirvana – this is correct, but what you are essentially doing is adding a Java component to a Java container – you are not adding the Matlab uicontrol. In this respect, using the underlying Java peer (via findjobj) is bypassing this limitation. Unfortunately, axes do not have similar Java peers that can be manipulated in a similar manner – they do have a Java canvas that can be accessed, but it extends over the entire figure’s ContentPane (in theory you could try to resize that canvas and add it to the JContainer, but odd things might result…).
True, we add java peers and not uicontrol handles themselves, but at the end of the day it does allow us to effectively manage the layout of arbitrary uicontrols (and java components) using flexible Java layout managers, which, I think, not a lot of people realize.
Btw, thanks for all your great utilities and tips : )