Undocumented Matlab
  • SERVICES
    • Consulting
    • Development
    • Training
    • Gallery
    • Testimonials
  • PRODUCTS
    • IQML: IQFeed-Matlab connector
    • IB-Matlab: InteractiveBrokers-Matlab connector
    • EODML: EODHistoricalData-Matlab connector
    • Webinars
  • BOOKS
    • Secrets of MATLAB-Java Programming
    • Accelerating MATLAB Performance
    • MATLAB Succinctly
  • ARTICLES
  • ABOUT
    • Policies
  • CONTACT

Multi-line tooltips

November 2, 2011 5 Comments

I often use tooltips in my Matlab GUIs. They are a fantastically intuitive and unobtrusive visual helper for users to understand the GUI. In this blog, I have already posted several articles about how to tweak tooltip contents (here, here, and here). Today I would like to expand on one of the aspects that were already covered, namely that of multi-line tooltips.

Basic multi-line tooltips

The basic multi-line tooltip consists of a simple string that includes the newline character. for example:

set(hControl, 'TooltipString', ['this is line 1' 10 'and this is line 2'])

set(hControl, 'TooltipString', ['this is line 1' 10 'and this is line 2'])

Or better (platform independent):

set(hControl, 'TooltipString', sprintf('this is line 1\nand this is line 2'))

set(hControl, 'TooltipString', sprintf('this is line 1\nand this is line 2'))

A simple multi-line tooltip string

As can be seen, this is very simple to set up. Unfortunately, the font cannot be customized. Which leads us to:

HTML-rendered multi-line tooltips

Tooltips, like most other Matlab controls, supports HTML rendering. This is a natural corollary of the fact that Java Swing, on which all Matlab controls are based, automatically supports HTML. All we need to do is to add ‘<HTML>‘ at the very beginning of our tooltip string, and then we can embed HTML tags within the rest of the string:

set(hControl, 'tooltipString', '<html><b>line #1</b><br /><i><font color="red">line#2</font></i></html>');

set(hControl, 'tooltipString', '<html><b>line #1</b><br /><i><font color="red">line#2</font></i></html>');

Multi-line HTML'ed tooltip

And a more sophisticated example, used within my createTable utility on the File Exchange:
A more complex multi-line HTML-based tooltip

Note that there is no need to close the final HTML tags in the tooltip string, although it’s not an error to do so (as I have done above).

The problem with formatted multi-line tooltip

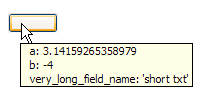
Unfortunately, none of these two methods work when we wish to display formatted multi-line tooltips. For example, suppose that we wish to display struct data in a tooltip:

>> myData = struct('a',pi, 'b',-4, 'very_long_field_name','short txt')
myData =
                       a: 3.14159265358979
                       b: -4
    very_long_field_name: 'short txt'
>> myDataStr = evalc('disp(myData)');
>> set(hControl, 'TooltipString', myDataStr);

>> myData = struct('a',pi, 'b',-4, 'very_long_field_name','short txt') myData = a: 3.14159265358979 b: -4 very_long_field_name: 'short txt' >> myDataStr = evalc('disp(myData)'); >> set(hControl, 'TooltipString', myDataStr);

Badly-formatted multi-line tooltip

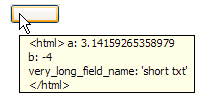
If we try to use HTML, the result looks even worse, because if the HTML-renderer detects a newline character embedded in the string, it simply uses the regular (non-HTML) renderer:

set(hControl, 'TooltipString', ['<html>' myDataStr '</html>'])

set(hControl, 'TooltipString', ['<html>' myDataStr '</html>'])

Failure to parse a string using HTML

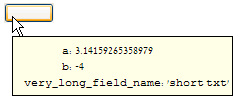
Even if we fix this by replacing all line-separators with ‘<br/>‘, we still get a badly-formatted tooltip, because HTML ignores all white spaces:

>> myDataStr2 = strrep(myDataStr, sprintf('\n'), '<br />');
>> set(hControl, 'TooltipString', ['<html>' myDataStr2 '</html>'])

>> myDataStr2 = strrep(myDataStr, sprintf('\n'), '<br />'); >> set(hControl, 'TooltipString', ['<html>' myDataStr2 '</html>'])

Badly-formatted multi-line tooltip

(you can see that it’s HTML-formatted by the fact that the tooltip contents do not have internal margins like in the non-HTML tooltip above)

Fixed-width font multi-line tooltips

We now recall the HTML <pre> tag, which tells HTML not to ignore white-spaces. In most web browsers, it also defaults to using a fixed-width font. Unfortunately, this is not the case here:

set(hControl, 'TooltipString', ['<html><pre>' myDataStr2])

set(hControl, 'TooltipString', ['<html><pre>' myDataStr2])

Still not quite right...

Which brings us to the final customization of the day, namely explicitly forcing the tooltip to use a fixed-width font:

set(hControl, 'TooltipString', ['<html><pre><font face="courier new">' myDataStr2 '</font>'])

set(hControl, 'TooltipString', ['<html><pre><font face="courier new">' myDataStr2 '</font>'])

Finally - a well-formatted multi-line tooltip

Even more powerful customizations can be achieved using CSS rather than pure HTML. This will be discussed a future article.

Related posts:

  1. Multi-line uitable column headers – Matlab uitables can present long column headers in multiple lines, for improved readability. ...
  2. Spicing up Matlab uicontrol tooltips – Matlab uicontrol tooltips can be spiced-up using HTML and CSS, including fonts, colors, tables and images...
  3. Inactive Control Tooltips & Event Chaining – Inactive Matlab uicontrols cannot normally display their tooltips. This article shows how to do this with a combination of undocumented Matlab and Java hacks....
  4. Explicit multi-threading in Matlab part 2 – Matlab performance can be improved by employing .Net (C#, VB, F# or C++) threads. ...
  5. Multi-column (grid) legend – This article explains how to use undocumented axes listeners for implementing multi-column plot legends...
  6. Explicit multi-threading in Matlab part 4 – Matlab performance can be improved by employing timer objects and spawning external processes. ...
GUI HTML Pure Matlab Tooltip
Print Print
« Previous
Next »
5 Responses
  1. Undocumented Profiler options part 2 | Undocumented Matlab September 24, 2012 at 03:24 Reply

    […] recall my related article last year, where I showed how to convert a proportional-font multi-line tooltip […]

  2. Simon April 29, 2019 at 17:25 Reply

    Does anyone know if multi line tooltips are possible for Digraph plots?

    This strategy doesn’t appear to work…

    • Yair Altman June 20, 2019 at 14:28 Reply

      @Simon – I assume that you mean the data-tip that is displayed next to the nodes in a digraph plot – this is not a tooltip but a data-tip (also called a datacursor): tooltips (which are the topic of this article) are Java components that are displayed next to Java GUI controls (buttons, checkboxes, editboxes etc.). In contrast, data-tips are non-Java graphic areas that are only displayed within graphic axes and use a completely different technology. Datacursor popups are not tooltips and they do not support HTML, although they do support Tex/Latex (like other graphics/axes text objects).

      Basic customizations of the data-tip text is supported and fully documented in Matlab; I described various undocumented ways to control data-tips in other articles.

  3. Ozgu June 18, 2019 at 22:14 Reply

    Hi Yair

    Can we adjust the position of the TooltipString?

    • Yair Altman June 20, 2019 at 14:09 Reply

      @Ozgu – you cannot control tooltip position for Matlab controls. You can only do this with custom Java components in which you overload the getToolTipLocation() method.

Leave a Reply
HTML tags such as <b> or <i> are accepted.
Wrap code fragments inside <pre lang="matlab"> tags, like this:
<pre lang="matlab">
a = magic(3);
disp(sum(a))
</pre>
I reserve the right to edit/delete comments (read the site policies).
Not all comments will be answered. You can always email me (altmany at gmail) for private consulting.

Click here to cancel reply.

Useful links
  •  Email Yair Altman
  •  Subscribe to new posts (email)
  •  Subscribe to new posts (feed)
  •  Subscribe to new posts (reader)
  •  Subscribe to comments (feed)
 
Accelerating MATLAB Performance book
Recent Posts

Speeding-up builtin Matlab functions – part 3

Improving graphics interactivity

Interesting Matlab puzzle – analysis

Interesting Matlab puzzle

Undocumented plot marker types

Matlab toolstrip – part 9 (popup figures)

Matlab toolstrip – part 8 (galleries)

Matlab toolstrip – part 7 (selection controls)

Matlab toolstrip – part 6 (complex controls)

Matlab toolstrip – part 5 (icons)

Matlab toolstrip – part 4 (control customization)

Reverting axes controls in figure toolbar

Matlab toolstrip – part 3 (basic customization)

Matlab toolstrip – part 2 (ToolGroup App)

Matlab toolstrip – part 1

Categories
  • Desktop (45)
  • Figure window (59)
  • Guest bloggers (65)
  • GUI (165)
  • Handle graphics (84)
  • Hidden property (42)
  • Icons (15)
  • Java (174)
  • Listeners (22)
  • Memory (16)
  • Mex (13)
  • Presumed future risk (394)
    • High risk of breaking in future versions (100)
    • Low risk of breaking in future versions (160)
    • Medium risk of breaking in future versions (136)
  • Public presentation (6)
  • Semi-documented feature (10)
  • Semi-documented function (35)
  • Stock Matlab function (140)
  • Toolbox (10)
  • UI controls (52)
  • Uncategorized (13)
  • Undocumented feature (217)
  • Undocumented function (37)
Tags
ActiveX (6) AppDesigner (9) Callbacks (31) Compiler (10) Desktop (38) Donn Shull (10) Editor (8) Figure (19) FindJObj (27) GUI (141) GUIDE (8) Handle graphics (78) HG2 (34) Hidden property (51) HTML (26) Icons (9) Internal component (39) Java (178) JavaFrame (20) JIDE (19) JMI (8) Listener (17) Malcolm Lidierth (8) MCOS (11) Memory (13) Menubar (9) Mex (14) Optical illusion (11) Performance (78) Profiler (9) Pure Matlab (187) schema (7) schema.class (8) schema.prop (18) Semi-documented feature (6) Semi-documented function (33) Toolbar (14) Toolstrip (13) uicontrol (37) uifigure (8) UIInspect (12) uitools (20) Undocumented feature (187) Undocumented function (37) Undocumented property (20)
Recent Comments
  • Marcel (9 days 17 hours ago): Hi, I am trying to set the legend to Static, but this command seems not to work in R2022a anymore: set(gca,’LegendColorbarL isteners’,[]); Any ideas? THANKS / marcel
  • Gres (9 days 21 hours ago): In 2018b, you can get the icons by calling [hh,icons,plots,txt] = legend({‘Line 1’});
  • Yair Altman (11 days 16 hours ago): @Mitchell – in most cases the user wants a single string identifier for the computer, that uniquely identifies it with a distinct fingerprint that is different from any...
  • Mitchell (12 days 0 hours ago): Great post! I’m not very familiar with the network interfaces being referenced here, but it seems like the java-based cross-platform method concatenates all network...
  • Yair Altman (14 days 18 hours ago): Dani – You can use jViewport.setViewPosition(java .awt.Point(0,0)) as I showed in earlier comments here
  • dani (15 days 13 hours ago): hi!! how i can set the horizontal scrollbar to the leftside when appearing! now it set to right side of text
  • Yair Altman (24 days 10 hours ago): Dom – call drawnow *just before* you set hLine.MarkerHandle.FaceColorTy pe to 'truecoloralpha'. Also, you made a typo in your code: it’s truecoloralpha, not...
  • Dom (25 days 8 hours ago): Yair I have tried your code with trucoloralpha and the markers do not appear transparent in R2021b, same as for Oliver.
  • Yair Altman (28 days 16 hours ago): Ren – This is usually the expected behavior, which avoids unnecessary duplications of the Excel process in CPU/memory. If you want to kill the process you can always run...
  • Yair Altman (29 days 6 hours ago): When you use plot() without hold(‘on’), each new plot() clears the axes and draws a new line, so your second plot() of p2 caused the first plot() line (p1) to be...
  • Cesim Dumlu (35 days 13 hours ago): Hello. I am trying to do a gradient plot for multiple functions to be displayed on the same axes and each one is colorcoded by respective colordata, using the same scaling. The...
  • Yair Altman (43 days 16 hours ago): @Veronica – you are using the new version of uitree, which uses HTML-based uifigures, and my post was about the Java-based uitree which uses legacy Matlab figures. For...
  • Veronica Taurino (43 days 16 hours ago): >> [txt1,txt2] ans = ‘abrakadabra’
  • Veronica Taurino (43 days 17 hours ago): Hello, I am just trying to change the uitree node name as you suggested: txt1 = 'abra'; txt2 = 'kadabra'; node.setName([txt1,txt2]); >> "Unrecognized method, property, or...
  • Yair Altman (46 days 17 hours ago): The version of JGraph that you downloaded uses a newer version of Java (11) than the one that Matlab supports (8). You need to either (1) find an earlier version of JGraph that...
Contact us
Undocumented Matlab © 2009 - Yair Altman
This website and Octahedron Ltd. are not affiliated with The MathWorks Inc.; MATLAB® is a registered trademark of The MathWorks Inc.
Scroll to top