Last week I gave a presentation at the MATLAB Computational Finance Conference in New York. The room was packed-full with close to 200 professionals in the finance industry. The energy and feedback were tremendous, it was a great experience. The presentation (PDF format) is provided here.
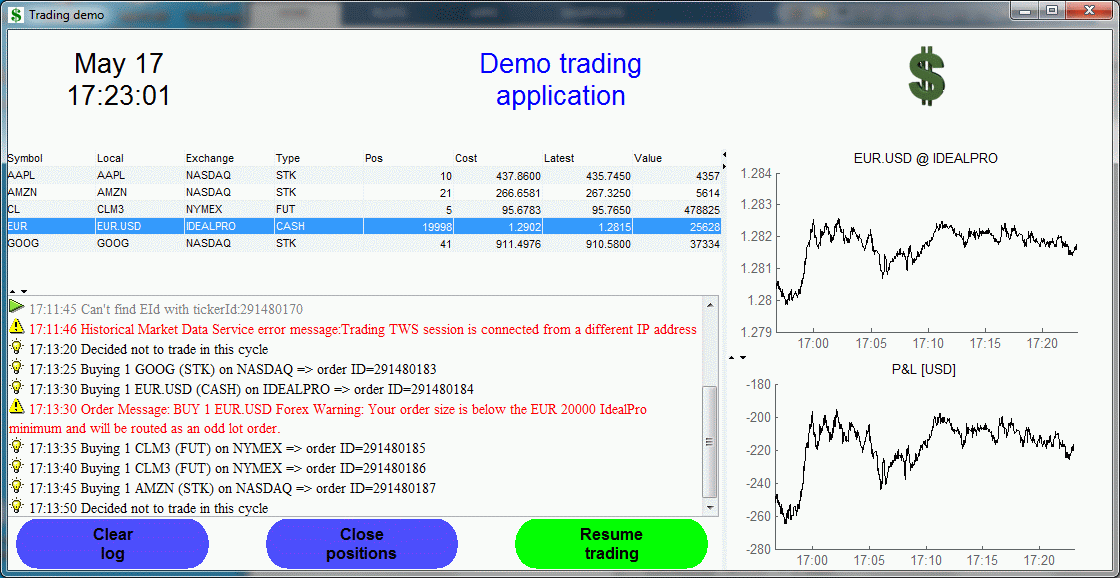
I presented a demo application that showed how Matlab can be used to create a full end-to-end trading system, highlighting Matlab’s potential as a platform of choice. I used Interactive Brokers to demonstrate live market data feed and account/portfolio input, as well as for sending trading orders to the market, via the IB-Matlab connector:

The demo system’s user interface showcased the hidden visualization and interactivity potential of MATLAB for tracking order executions and charting financial time-series in real time. The undocumented features used in the demo include:
- Animated GIF logo image (rotating Dollar sign)
- Customized data table
- Log box with rich HTML contents: icons and color-coded messages
- Draggable (resizable) panel borders (note that this feature does not work in the new HG2 – I hope it will be fixed by the time that HG2 is released)
- Maximized figure window
The demo source code is provided here (tradingDemo.m and supporting files). Note that this is provided as-is, free of charge but without any warranty or support. You would naturally need IB-Matlab and an Interactive Brokers account to run it.
If you came to the conference, I want to thank you for being an excellent audience. I hope we have a chance to work together on your projects. Shoot me an email if you’d like my help in any consulting, training or development work.


[…] Undocumented Matlab Charting Matlab’s unsupported hidden underbelly Skip to content HomeAboutConsultingTrainingIB-MatlabMatlab-Java bookTODOPoliciesSite map ← HG2 update Real-time trading system demo → […]