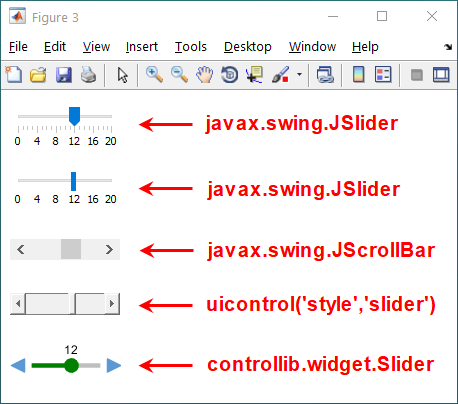
Exactly 3 years ago I posted about various alternatives for embedding sliders in Matlab GUI. Today I will follow up on that post with a description of yet another undocumented builtin alternative – controllib.widget.Slider. A summary of the various alternatives can be seen in the following screenshot:

The controllib.widget.Slider component is a class in Matlab’s internal
controllib package (last week I discussed a different utility function in this package, controllib.internal.util.hString2Char).controllib.widget.Slider accepts 3 input arguments: containing figure handle, position in pixels, and data values. For example:
>> hSlider = controllib.widget.Slider(gcf, [10,10,100,50], 5:25) hSlider = Slider with properties: Data: [6 7 8 9 10 11 12 13 14 15 16 17 18 19 20 21 22 23 24 25] Index: 11 Value: 15 FontSize: 8 Position: [10 10 100 50] |
This creates an invisible axes at the specified figure location and displays graphic axes objects that provide the appearance of the slider. When you move the slider’s knob, or click its centerline or arrows (“Steppers”), the slider’s value changes accordingly.
You can attach a callback function to the slider as follows:
myCallback = @(h,e) disp(h.Value); % as an example addlistener(hSlider, 'ValueChanged', myCallback); |
Note that controllib.widget.Slider is based on pure-Matlab code and fully-supported functionality. The Matlab source code is available (%matlabroot%/toolbox/shared/controllib/graphics/+controllib/+widget/Slider.m) and quite readable. So while it does not actually work with the new web-based uifigures, is should be relatively easy to adapt the code so that this component could be displayed in such uifigures.
Below is a script to recreate the screenshot above. Note the two alternative mechanisms for setting properties (Java setter-method notation, and HG set notation):
hFig = figure('Color','w'); % 1. controllib.widget.Slider hSlider1 = controllib.widget.Slider(hFig, [10,10,100,50], 1:20); hSlider1.Value = 12; % 2. uicontrol hSlider2 = uicontrol('style','slider', 'units','pixels', 'pos',[10,80,100,20], 'Min',0', 'Max',20, 'Value',12); % 3. JScrollBar jSlider3 = javaObjectEDT(javax.swing.JScrollBar); jSlider3.setOrientation(jSlider3.HORIZONTAL); % Java setter-method notation set(jSlider3, 'VisibleAmount',1, 'Minimum',0, 'Maximum',20, 'Value',12); % HG set notation [hSlider3, hContainer3] = javacomponent(jSlider3, [10,130,100,20], hFig); % 4. JSlider #1 jSlider4 = javaObjectEDT(javax.swing.JSlider(0,20,12)) jSlider4.setBackground(java.awt.Color.white); % Java setter-method notation set(jSlider4, 'MinorTickSpacing',1, 'MajorTickSpacing',4, 'SnapToTicks',true, 'PaintLabels',true); % HG set notation [hSlider4, hContainer4] = javacomponent(jSlider4, [10,180,100,30], hFig); % 5. JSlider #2 jSlider5 = javaObjectEDT(javax.swing.JSlider(0,20,12)) jSlider5.setBackground(java.awt.Color.white); % Java setter-method notation jSlider5.setPaintTicks(true); set(jSlider5, 'MinorTickSpacing',1, 'MajorTickSpacing',4, 'SnapToTicks',true, 'PaintLabels',true); % HG set notation [hSlider5, hContainer5] = javacomponent(jSlider5, [10,230,100,40], hFig); |
For additional details regarding the other slider alternatives, please refer to my earlier post on this subject.
Have you ever used another interesting utility or class in Matlab’s builtin packages? If so, please tell us about it in a comment below.


In R2015b I only see the *+app*, the and the *+plot* packages inside the *+controllib* package, no *widget*.
@Zoltan – R2015b is 6 releases older than the latest Matlab release, so surely this is no surprise. New functions are being added to Matlab with each new release. If you upgrade to one of the latest Matlab releases you will be able to use this function.
how can i plot many data with slider in Gui?
@Medi – I am not sure what you mean. I discussed a slider that has several knobs (“range slider”) here: http://undocumentedmatlab.com/blog/sliders-in-matlab-gui#range
do any of these sliders execute a callback not just when the values is changed, or when the mouse button is released, but as the mouse *moves*?
I’m trying to implement a slider where the limits automatically expand as you get to the edges. I don’t think this is possible with uicontrol, and i wonder if it’s possible with the others.
You can do this with practically all of them. See here for example: http://undocumentedmatlab.com/blog/continuous-slider-callback
I do not see a visible (on/off) property. Is there a way hide/unhide these, specifically controllib.widget.Slider.
I currently just use Position and move it out of visible range. Also, can it be deleted? (It can, but leaves the widget).
@Don – you can control the components of
controllib.widget.Sliderusing its internal properties, as follows:You can also control individual slider components this way. For example, to hide the stepper triangles on the right and on the left:
To delete the slider altogether, delete its container axes:
Is there a possibility to rotate the controllib.widget.Slider? So to have it vertical?
Thanks!