The major innovation in Matlab release R2014b was the introduction of the new handle-based graphics system (HG2). However, this release also included a few other improvements to graphics/GUI that should not be overlooked. The most notable is that uitabs are finally officially documented/supported, following a decade or being undocumented (well, undocumented in the official sense, since I took the time to document this functionality in this blog and in my Matlab-Java book).
A less-visible improvement occurred with uipanels: Panels are very important containers when designing GUIs. They enable a visual grouping of related controls and introduce order to an otherwise complex GUI. Unfortunately, until R2014b panels were drawn at the canvas level, and did not use a standard Java Swing controls like other uicontrols. This made it impossible to customize uipanels in a similar manner to other GUI uicontrols (example).
In R2014b, uipanels have finally become standard Java Swing controls, a com.mathworks.hg.peer.ui.UIPanelPeer$UIPanelJPanel component that extends Swing’s standard javax.swing.JPanel and Matlab’s ubiquitous com.mathworks.mwswing.MJPanel. This means that we can finally customize it in various ways that are not available in plain Matlab.
We start the discussion with a simple Matlab code snippet. It is deliberately simple, since I wish to demonstrate only the panel aspects:
figure('Menubar','none', 'Color','w'); hPanel = uipanel('Title','Panel title', 'Units','norm', 'Pos',[.1,.1,.6,.7]); hButton = uicontrol('String','Click!', 'Parent',hPanel); |
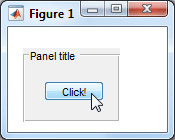
Notice the default ‘etchedin’ panel border, which I hate (note the broken edges at the corners). Luckily, Swing includes a wide range of alternative borders that we can use. I’ve already demonstrated customizing Matlab uicontrols with Java borders back in 2010 (has it really been that long? wow!). In R2014b we can finally do something similar to uipanels:
The first step is to get the uipanel‘s underlying Java component’s reference. We can do this using my findjobj utility, but in the specific case of uipanel we are lucky to have a direct shortcut by using the panel’s undocumented hidden property JavaFrame and its PrintableComponent property:
>> jPanel = hPanel.JavaFrame.getPrintableComponent jPanel = com.mathworks.hg.peer.ui.UIPanelPeer$UIPanelJPanel[,0,0,97x74,...] |
Let’s now take a look at the jPanel‘s border:
>> jPanel.getBorder ans = com.mathworks.hg.peer.ui.borders.TitledBorder@25cd9b97 >> jPanel.getBorder.get Border: [1x1 com.mathworks.hg.peer.ui.borders.EtchedBorderWithThickness] BorderOpaque: 0 Class: [1x1 java.lang.Class] Title: 'Panel title' TitleColor: [1x1 java.awt.Color] TitleFont: [1x1 java.awt.Font] TitleJustification: 1 TitlePosition: 2 |
Ok, simple enough. Let’s replace the border’s EtchedBorderWithThickness with something more appealing. We start with a simple red LineBorder having rounded corners and 1px width:
jColor = java.awt.Color.red; % or: java.awt.Color(1,0,0) jNewBorder = javax.swing.border.LineBorder(jColor, 1, true); % red, 1px, rounded=true jPanel.getBorder.setBorder(jNewBorder); jPanel.repaint; % redraw the modified panel |
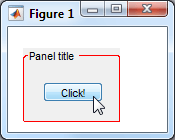
Or maybe a thicker non-rounded orange border:
jColor = java.awt.Color(1,0.5,0); jNewBorder = javax.swing.border.LineBorder(jColor, 3, false); % orange, 3px, rounded=false jPanel.getBorder.setBorder(jNewBorder); jPanel.repaint; % redraw the modified panel |
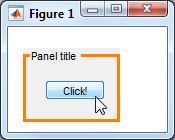
Or maybe a
MatteBorder with colored insets:
jColor = java.awt.Color(0,0.3,0.8); % light-blue jNewBorder = javax.swing.border.MatteBorder(2,5,8,11,jColor) % top,left,bottom,right, color jPanel.getBorder.setBorder(jNewBorder); jPanel.repaint; % redraw the modified panel |
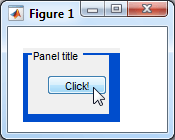
MatteBorder can also use an icon (rather than a solid color) to fill the border insets. First, let’s load the icon. We can either load a file directly from disk, or use one of Matlab’s standard icons. Here are both of these alternatives:
% Alternative #1: load from disk file icon = javax.swing.ImageIcon('C:\Yair\star.gif'); % Alternative #2: load a Matlab resource file jarFile = fullfile(matlabroot,'/java/jar/mlwidgets.jar'); iconsFolder = '/com/mathworks/mlwidgets/graphics/resources/'; iconURI = ['jar:file:/' jarFile '!' iconsFolder 'favorite_hoverover.png']; % 14x14 px icon = javax.swing.ImageIcon(java.net.URL(iconURI)); |
We can now pass this icon reference to MatteBorder‘s constructor:
w = icon.getIconWidth; h = icon.getIconHeight; jNewBorder = javax.swing.border.MatteBorder(h,w,h,w,icon) % top,left,bottom,right, icon jPanel.getBorder.setBorder(jNewBorder); jPanel.repaint; % redraw the modified panel |
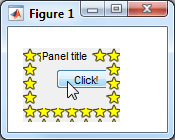
Additional useful Swing borders can be found in the list of classes implementing the
Border interface, or via the BorderFactory class. For example, let’s create a dashed border having a 3-2 ratio between the line lengths and the spacing:
jColor = java.awt.Color.blue; % or: java.awt.Color(0,0,1); lineWidth = 1; relativeLineLength = 3; relativeSpacing = 2; isRounded = false; jNewBorder = javax.swing.BorderFactory.createDashedBorder(jColor,lineWidth,relativeLineLength,relativeSpacing,isRounded); jPanel.getBorder.setBorder(jNewBorder); jPanel.repaint; % redraw the modified panel |
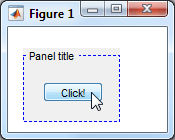
After seeing all these possibilities, I think you’ll agree with me that Matlab’s standard uipanel borders look pale in comparison.
Have you used any interesting borders in your Matlab GUI? Or have you customized your panels in some other nifty manner? If so, then please place a comment below.


Thanks for your great blog.
Trying it out for fun All this Java / GUI stuff is not very familiar to me..) I did get an error with
but
was OK
@Julian – please state your exact code snippet and the error you received – it should have worked without any error.
Thanks Yair for this very interesting post… It is indeed a very good news! More than its aspect (borders, titles), it is finally a “real” java container in which we will be able to use java layout managers and which will naturally clip its components. It was time!
I am sorry but I do not have the R2014B yet… I was wondering if you had prospected axes objects. Are they now JComponents like uipanels or are they still draws at the canvas level?
@Julien – HG2 graphics are still drawn at the canvas-level. The canvas itself has changed: it is now a
com.mathworks.hg.peer.JavaSceneServerGLJPanelobject, which is a MathWorks extension of the standardjavax.media.opengl.awt.GLJPanelpanel when the figure renderer is OpenGL, andcom.mathworks.hg.peer.JavaSceneServerPanelwhen the renderer is Painters.In 14b, ZBuffer is no longer a documented figure renderer option (you don’t see it when you run
set(gcf,'Renderer')). However, it is still an accepted renderer value, and apparently revert to the OpenGL renderer, resulting in aGLJPanel. This was probably done by MathWorks for backward compatibility with existing code which might deliberately request a ZBuffer renderer.Thanks… I was dreaming to a world where axes would have their own containers so that they could be added to any Java container, or could be scrolled.
So, there are still 2 overlayed content panes, one for uicontrols and uipanels and another for graphics (actually 2, depending on renderer). Do you have an idea of the reason why graphics is drawn like this at the canvas level ?
@Julien – I assume this is done for performance reasons, graphics being drawn by native C code. However I don’t know this for a fact.
I have found that GUIDE graphics are impossibly broken in 2014b. In the guide designer, controls disappear and cannot be made to reappear only with great effort and luck. In addition, controls with normalized units sometimes have their position values reset to all zeros or to 0 and 1.
The only workaround I have gotten from Mathworks is to convert to a programmatic interface.
@Tom – …or to hire a professional Matlab expert to do it for you… 🙂
I have experienced the same problem with position values getting reset for controls within panels. I believe that this does not happen if the figure is changed to be non-resizable.
Hi Yair,
I found that when I invoke jpanel.JavaFrame.getPrintableComponent in my script, it will return something like this:
com.mathworks.hg.peer.ui.UIPanelPeer$UIPanelJPanel[,0,0,0x0,invalid,layout=...]However when I invoke this in the command window, it will return normal value:
com.mathworks.hg.peer.ui.UIPanelPeer$UIPanelJPanel[,0,0,300x300,layout=...]Why does this happen?
I was using MATLAB 2014b.
@LSH – this is probably an EDT timing issue. Add a call to drawnow before requesting the PrintableComponent.
Hi Yair,
Thanks for sharing this info.
I was wondering how would one potentially remember these commands :
as in how would one know to look specifically into
javax.swing.border.LineBorderto create the new java border..seems a long name to commit to memory
@Mhyd – simple: Google “java border” and the very first search result is Java’s official tutorial on how to use Java borders, and this includes a short discussion of various predefined border styles, including
LineBorderwhich is the simplest border.It helps a lot. Thank you !
Does it work in MATLAB Compiler ? I do not see a reason why it should not but I would like to have your confirmation.