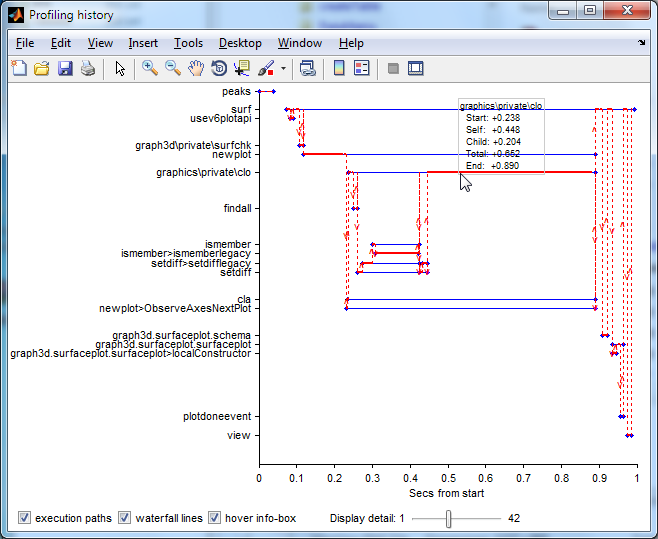
I regularly follow the MathWorks Pick-of-the-Week (POTW) blog. In a recent post, Jiro Doke highlighted Per Isakson’s tracer4m utility. Per is an accomplished Matlab programmer, who has a solid reputation in the Matlab user community for many years. His utility uses temporary conditional breakpoints to enable users to trace calls to their Matlab functions and class methods. This uses a little-known trick that I wish to highlight in this post.

Matlab breakpoints are documented and supported functionality, and yet their documented use is typically focused at interactive programming in the Matlab editor, or as interactive commands that are entered in the Matlab console using the set of db* functions: dbstop, dbclear, dbstatus, dbstack etc. However, nothing prevents us from using these db* functions directly within our code.
For example, the dbstack function can help us diagnose the calling tree for the current function, in order to do action A if one of the calling ancestors was FunctionX, or to do action B otherwise (for example, to avoid nested recursions).
Similarly, we could add a programmatic call to dbstop in order to stop at a certain code location downstream (for debugging), if a certain condition happens upstream.
Per extended this idea very cleverly in tracer4m: conditional breakpoints evaluate a string in run-time: if the result is true (non-zero) then the code run is stopped at that location, but if it’s false (or zero) then the code run continues normally. To instrument calls to specific functions, Per created a function
tracer() that logs the function call (using dbstack) and always returns the value false. He then dynamically created a string that contains a call to this new function and used the dbstop function to create a conditional breakpoint based on this function, something similar to this:
dbstop('in', filename, 'at', location, 'if', 'tracer()'); |
We can use this same technique for other purposes. For example, if we want to do some action (not necessarily log – perhaps do something else) when a certain code point is reached. The benefit here is that we don’t need to modify the code at all – we’re adding ad-hoc code pieces using the conditional breakpoint mechanism without affecting the source code. This is particularly useful when we do not have access to the source code (such as when it’s compiled or write-protected). All you need to do is to ensure that the instrumentation function always returns false so that the breakpoint does not become live and for code execution to continue normally.
The tracer4m utility is quite sophisticated in the sense that it uses mlint and smart regexp to parse the code and know which functions/methods occur on which line numbers and have which type (more details). In this sense, Per used undocumented functionality. I’m certain that Jiro was not aware of the dependency on undocumented features when he posted about the utility, so please don’t take this to mean that Jiro or MathWorks officially support this or any other undocumented functionality. Undocumented aspects are often needed to achieve top functionality, and I’m happy that the POTW blog highlights utilities based on their importance and merit, even if they do happen to use some undocumented aspect.
tracer4m‘s code also contains references to the undocumented profiler option -history, but this is not in fact used by the code itself, only in comments. I use this feature in my profile_history utility, which displays the function call/timing history in an interactive GUI window. This utility complements tracer4m by providing a lot more information, but this can result in a huge amount of information for large and/or long-running programs. In addition, tracer4m has the benefit of only logging those functions/methods that the user finds useful, rather than all the function call, which enables easier debugging when the relevant code area is known. In short, I wish I had known about tracer4m when I created profile_history. Now that I know about it, maybe I’ll incorporate some of its ideas into profile_history in order to make it more useful. Perhaps another moral of this is that we should actively monitor the POTW blog, because true gems are quite often highlighted there.

Function call timeline profiling
For anyone who missed the announcement in my previous post, I’m hosting a series of live webinars on advanced Matlab topics in the upcoming 2 weeks – I’ll be happy if you would join.


Hello.
You mentioned that this technique could be useful for compiled code, but I thought that break points didn’t work in compilied code. Do you know of an undocumented work around?
Thank you for all the useful advice you post on this blog.
@Mark – I meant p-coded code
Thank you.