Undocumented Matlab
  • SERVICES
    • Consulting
    • Development
    • Training
    • Gallery
    • Testimonials
  • PRODUCTS
    • IQML: IQFeed-Matlab connector
    • IB-Matlab: InteractiveBrokers-Matlab connector
    • EODML: EODHistoricalData-Matlab connector
    • Webinars
  • BOOKS
    • Secrets of MATLAB-Java Programming
    • Accelerating MATLAB Performance
    • MATLAB Succinctly
  • ARTICLES
  • ABOUT
    • Policies
  • CONTACT

Persisting transparent colors in HG2

June 3, 2015 2 Comments

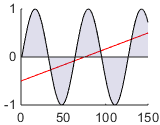
Several months ago, I showed how we can set semi- and fully-transparent colors in HG2 (Matlab’s new graphics engine, starting in R2014b) for multiple graphic objects, including plot lines, plot markers, and area charts:

hLine = plot([0,150], [-0.5,0.5], 'r');
box off; hold on;
ydata = sin(0:0.1:15);
hArea = area(ydata);
drawnow; pause(0.05);  % this is important!
hArea.Face.ColorType = 'truecoloralpha';
hArea.Face.ColorData(4) = 40;  % 40/255 = 0.16 opacity = 84% transparent

hLine = plot([0,150], [-0.5,0.5], 'r'); box off; hold on; ydata = sin(0:0.1:15); hArea = area(ydata); drawnow; pause(0.05); % this is important! hArea.Face.ColorType = 'truecoloralpha'; hArea.Face.ColorData(4) = 40; % 40/255 = 0.16 opacity = 84% transparent

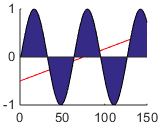
Unfortunately, these settings are automatically overridden by Matlab when the figure is printed, saved, or exported:

% These commands result in an opaque (non-transparent) plot
print(gcf);
saveas(gcf, 'plot.png');

% These commands result in an opaque (non-transparent) plot print(gcf); saveas(gcf, 'plot.png');

Transparent area plot (ok)   Opaque area plot (not ok)
Area plot: transparent (ok) and opaque (not ok)


In some cases, the settings are lost even when the figure or axes is resized, or properties (e.g., Box) are changed. This is evident, for example, when the hLine plot line is not drawn, only the area plot.
The solution of one blog reader here was to simply set the undocumented color transparency settings at the very end of the graphics set-up. However, as noted, this still does not answer the need to preserve the color settings when the figure is printed, saved, exported, or resized, or when axes properties change.
Another reader, Richard de Garis of Collins Capital, found an undocumented feature that seems to solve the problem for good. It turns out that the solution is simply to set the color to a “legal” (documented, non-transparent) color before setting the transparency values:

hArea = area(ydata);
hArea.FaceColor = 'b';  % or any other non-transparent colordrawnow; pause(0.05);  % this is important!
hArea.Face.ColorType = 'truecoloralpha';
hArea.Face.ColorData(4) = 40;  % 40/255 = 0.16 opacity = 84% transparent

hArea = area(ydata); hArea.FaceColor = 'b'; % or any other non-transparent color drawnow; pause(0.05); % this is important! hArea.Face.ColorType = 'truecoloralpha'; hArea.Face.ColorData(4) = 40; % 40/255 = 0.16 opacity = 84% transparent

Now the transparency settings are preserved, even when the figure is printed, saved, exported, resized etc.
The obvious explanation is that by manually updating the graphic object’s FaceColor, Matlab automatically updates the hidden property FaceColorMode from ‘auto’ to ‘manual’. This signals the graphics engine not to override the Face‘s color when such an update would otherwise be called for. The mechanism of having a <PropName>Mode property associated with the <PropName> was used in HG1 (Matlab’s previous Matlab graphics engine, up to R2014a). In HG2, more properties have added such associated *Mode properties. In most cases, these additional *Mode properties are hidden, as FaceColorMode is. I find this justified, because in most cases users shouldn’t update these properties, and should let Matlab handle the logic.
Unfortunately, this explanation is apparently false, as evident by the fact that setting FaceColorMode from ‘auto’ to ‘manual’ does not have the same desired effect. So for now I don’t know how to explain this phenomenon. At least we know it works, even if we don’t fully understand why [yet]. Oh well, I guess we can’t win ’em all…
Have you discovered and used some other interesting undocumented feature of HG2? If so, please share it in a comment below, or email me the details.

Related posts:

  1. Transparent legend – Matlab chart legends are opaque be default but can be made semi- or fully transparent. ...
  2. Transparent uipanels – Matlab uipanels can be made transparent, for very useful effects. ...
  3. Transparent Matlab figure window – Matlab figure windows can be made fully or partially transparent/translucent or blurred - this article explains how...
  4. Transparent labels – Matlab labels can be set to a transparent background as well as padding. ...
  5. Auto-scale image colors – Images can be automatically color-scaled for maximum resolution, using the undocumented MarkedClean event. ...
  6. Changing Matlab's Command Window colors – part 2 – The Matlab Command Window enables a limited degree of inline color customization - this post describes how to use it...
Handle graphics HG2 Pure Matlab Undocumented feature
Print Print
« Previous
Next »
2 Responses
  1. Dani October 29, 2015 at 07:48 Reply

    Still does not survive a legend call.

  2. Jacob April 13, 2016 at 11:58 Reply

    I am finding this still does not persist with a resize.
    Has anyone found any other stable fixes?

Leave a Reply
HTML tags such as <b> or <i> are accepted.
Wrap code fragments inside <pre lang="matlab"> tags, like this:
<pre lang="matlab">
a = magic(3);
disp(sum(a))
</pre>
I reserve the right to edit/delete comments (read the site policies).
Not all comments will be answered. You can always email me (altmany at gmail) for private consulting.

Click here to cancel reply.

Useful links
  •  Email Yair Altman
  •  Subscribe to new posts (feed)
  •  Subscribe to new posts (reader)
  •  Subscribe to comments (feed)
 
Accelerating MATLAB Performance book
Recent Posts

Speeding-up builtin Matlab functions – part 3

Improving graphics interactivity

Interesting Matlab puzzle – analysis

Interesting Matlab puzzle

Undocumented plot marker types

Matlab toolstrip – part 9 (popup figures)

Matlab toolstrip – part 8 (galleries)

Matlab toolstrip – part 7 (selection controls)

Matlab toolstrip – part 6 (complex controls)

Matlab toolstrip – part 5 (icons)

Matlab toolstrip – part 4 (control customization)

Reverting axes controls in figure toolbar

Matlab toolstrip – part 3 (basic customization)

Matlab toolstrip – part 2 (ToolGroup App)

Matlab toolstrip – part 1

Categories
  • Desktop (45)
  • Figure window (59)
  • Guest bloggers (65)
  • GUI (165)
  • Handle graphics (84)
  • Hidden property (42)
  • Icons (15)
  • Java (174)
  • Listeners (22)
  • Memory (16)
  • Mex (13)
  • Presumed future risk (394)
    • High risk of breaking in future versions (100)
    • Low risk of breaking in future versions (160)
    • Medium risk of breaking in future versions (136)
  • Public presentation (6)
  • Semi-documented feature (10)
  • Semi-documented function (35)
  • Stock Matlab function (140)
  • Toolbox (10)
  • UI controls (52)
  • Uncategorized (13)
  • Undocumented feature (217)
  • Undocumented function (37)
Tags
ActiveX (6) AppDesigner (9) Callbacks (31) Compiler (10) Desktop (38) Donn Shull (10) Editor (8) Figure (19) FindJObj (27) GUI (141) GUIDE (8) Handle graphics (78) HG2 (34) Hidden property (51) HTML (26) Icons (9) Internal component (39) Java (178) JavaFrame (20) JIDE (19) JMI (8) Listener (17) Malcolm Lidierth (8) MCOS (11) Memory (13) Menubar (9) Mex (14) Optical illusion (11) Performance (78) Profiler (9) Pure Matlab (187) schema (7) schema.class (8) schema.prop (18) Semi-documented feature (6) Semi-documented function (33) Toolbar (14) Toolstrip (13) uicontrol (37) uifigure (8) UIInspect (12) uitools (20) Undocumented feature (187) Undocumented function (37) Undocumented property (20)
Recent Comments
  • Rolf (18 days 10 hours ago): Disclosure: This comes from the developer/vendor of the Code Checker for MATLAB. Have a look at the Code Checker for MATLAB by MonkeyProof Solutions which has many such (configurable)...
  • Yair Altman (26 days 4 hours ago): In theory you could use the data: URI scheme (e.g. .load('data:text/html,<html ><body>Hello world</body></html>')), but for some reason it doesn’t work well in...
  • Sebastian (26 days 9 hours ago): Thanks for your update to the now unsupported `HTMLBrowserPanel`. I tried to replace it with the `LightweightHelpPanel` but the application I am working on is showing generated...
  • Leuze (48 days 10 hours ago): Hello, I would like to add a new object into SLDD and display columns according to my object properties <>
  • Eric Delgado (77 days 13 hours ago): Hey Yair, I think your site is the right place to share that I wrote ccTools, a lib that allows a lot of customizations of Matlab built-in web components (such as uifigure,...
  • Eric Delgado (77 days 13 hours ago): Hey guys, first of all, thanks to @Yair, your site saved me a lot of times! 🙂 That’s why I am sharing that I wrote m2mlapp (*.m => *.mlapp) file conversion, that...
  • François (94 days 10 hours ago): more than 10 years later it helps me after struggling few hours, so thanks you very much !
  • Yair Altman (95 days 9 hours ago): I am not familiar with a universal catch-all tab-completion mechanism for all functions, and it also doesn’t make much sense to me, because different functions use...
  • Arye (96 days 3 hours ago): hi, is there a universal functionSignature.json file that will allow my to get the function hints when opening brackets of my funcs? something that automaticly recognize my function...
  • Sunham (98 days 21 hours ago): This is an old article, but the issue persists even in 2023. 2023a: z = mat2cell(1:1e6,1,repmat(1,1,1e 6)); f = @() cellfun(‘isempty’, z); g = @() cellfun(@isempty,z);...
  • Yair Altman (108 days 12 hours ago): Robot only runs when you tell it to run a command such as keyPress. If you don’t tell it to run a command, it uses no CPU, so there’s no need to remove the Robot...
  • Eric (108 days 23 hours ago): Hey @Kevin, can you share your code about create group of figures in the AppContainer? The container of multiples uifigures could be an amazing improvement over AppDesigner and its...
  • Elsa Smith (109 days 13 hours ago): I recently used java.awt.Robot to perform GUI testing on MATLAB and found it to be an extremely easy and useful way to control mouse movements.
  • Elsa Smith (109 days 14 hours ago): I’m suspecting that the slow performance of my GUI may be due to the use of java.awt.Robot. Is there a way to cancel/stop/remove the robot after it has been created, or is...
  • Michelle Kline (110 days 7 hours ago): *edit* tip about fopen(), not about fwrite(). ‘Wb’ vs. ‘wb’
Contact us
Captcha image for Custom Contact Forms plugin. You must type the numbers shown in the image
Undocumented Matlab © 2009 - Yair Altman
This website and Octahedron Ltd. are not affiliated with The MathWorks Inc.; MATLAB® is a registered trademark of The MathWorks Inc.
Scroll to top