Undocumented Matlab
  • SERVICES
    • Consulting
    • Development
    • Training
    • Gallery
    • Testimonials
  • PRODUCTS
    • IQML: IQFeed-Matlab connector
    • IB-Matlab: InteractiveBrokers-Matlab connector
    • EODML: EODHistoricalData-Matlab connector
    • Webinars
  • BOOKS
    • Secrets of MATLAB-Java Programming
    • Accelerating MATLAB Performance
    • MATLAB Succinctly
  • ARTICLES
  • ABOUT
    • Policies
  • CONTACT

Axes LooseInset property

March 24, 2010 21 Comments

Last week, I wrote an article about the hidden/undocumented LineSmoothing plot property. This week, I want to introduce another useful hidden/undocumented property – the plot axes’ LooseInset property. This follows on the wake of an email I received from a reader about this property, which had some new information for me (thanks Ben!).
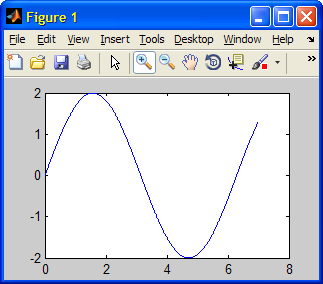
Apparently, LooseInset, which is automatically set to a factory value of [0.13, 0.11, 0.095, 0.075], is used by Matlab axes to reserve a small empty margin around the axes, presumably to enable space for tick marks. These empty margins can be very annoying at times, especially when we have directly control on the axes contents.

figure; t=0:0.01:7; plot(t,2*sin(t));

figure; t=0:0.01:7; plot(t,2*sin(t));

Axes with default LooseInset values (note the excessive margins)
Axes with default LooseInset values
(note the excessive margins)

If you set Position to [0 0 1 1], the labels are cut-off; if you set Position to something like [0.05 0.05 0.9 0.9], you can get the labels to show up, but if you now resize the image the labels may be cut off… Similarly, setting TightInset also does not work.
Theoretically, the solution should be to set OuterPosition to [0 0 1 1]. This is supposed to make the axes (including labels) take up the entire figure. However, it usually over-estimates the required margins, causing wasted space. Using OuterPosition also causes unexpected behaviors with sub-plots.
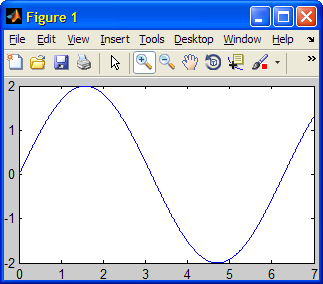
Solution: simply set LooseInset to [0 0 0 0]:

set(gca, 'LooseInset', [0,0,0,0]);

set(gca, 'LooseInset', [0,0,0,0]);

Axes with empty LooseInset values

To modify all future axes in the same way (i.e., have an empty LooseInset):

set(0,'DefaultAxesLooseInset',[0,0,0,0])

set(0,'DefaultAxesLooseInset',[0,0,0,0])

Clearing the LooseInset margins has a drawback: if the axes is zoomed or modified in such a way that the labels change, then the active axes plot region needs to shrink accordingly. For example:
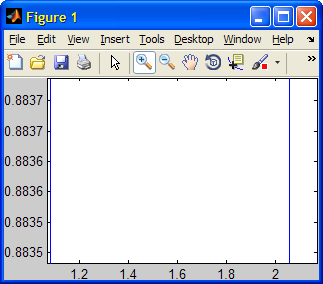
Axes with empty LooseInset values, wide tick labels (note the changed plot region size)
Axes with empty LooseInset values, wide tick labels
(note the changed plot region size)

When determining the size of the axes, it seems that Matlab takes into account larger of the documented TightInset and the undocumented LooseInset. So, perhaps a better generic solution would be the one suggested by another blog reader:

set(gca,'LooseInset',get(gca,'TightInset'))

set(gca,'LooseInset',get(gca,'TightInset'))

Note that the LooseInset property was first reported on CSSM back in 2007 (also here). The LooseInset property has remained hidden and undocumented to this day (Matlab 7.10, R2010a), although it has even featured in an official MathWorks Technical Solution to a reported problem about unexpected axes sizes last year.
p.s. – another undocumented property of Matlab axes, ContentsVisible, was described by Matt Whittaker in a comment on my original article that introduced undocumented properties.

Related posts:

  1. Customizing axes part 4 – additional properties – Matlab HG2 axes can be customized in many different ways. This article explains some of the undocumented aspects. ...
  2. Customizing axes tick labels – Multiple customizations can be applied to tick labels. ...
  3. Customizing axes part 3 – Backdrop – Matlab HG2 axes can be customized in many different ways. This article explains some of the undocumented aspects. ...
  4. Plot LineSmoothing property – LineSmoothing is a hidden and undocumented plot line property that creates anti-aliased (smooth unpixelized) lines in Matlab plots...
  5. Getting default HG property values – Matlab has documented how to modify default property values, but not how to get the full list of current defaults. This article explains how to do this. ...
  6. Customizing axes part 2 – Matlab HG2 axes can be customized in many different ways. This article explains some of the undocumented aspects. ...
Handle graphics Hidden property OuterPosition Pure Matlab Undocumented property
Print Print
« Previous
Next »
21 Responses
  1. Ralf March 31, 2010 at 00:47 Reply

    Nice to see that there is a simple solution for this problem and I do not have to write a Figure Resize Callback function for this purpose. However, in the case of “axis equal” the described procedure does not work since the figure position has to be set to produce a cropped window. Does anybody knows whether there is a simple method to compute cropped figure dimensions for equal axis with labels?

    • Oliver February 21, 2014 at 03:18 Reply

      @Ralf – I would need this too.

  2. Maurizio April 1, 2010 at 03:49 Reply

    Is there any similar defalut property like ‘DefaultAxesLooseInset’ for subplots?

    • Yair Altman April 1, 2010 at 04:06 Reply

      @Maurizio – there is only one DefaultAxesLooseInset property in the root (0) handle – there is no distinction between main axes and sub-plots, since sub-plots are simply a set of axes that are distributed (laid-out) nicely within the figure. So, setting the DefaultAxesLooseInset property affects all the subplot axes.

  3. Vladi July 24, 2012 at 14:49 Reply

    This statement:
    set(0,’DefaultAxesLooseInset’,[0,0,0,0])
    .. seems don’t work (R2012a)

    • Vladi July 24, 2012 at 15:34 Reply

      recall on my previous post:
      .. seems does work, but only at main axes level..doesn’t affect subplot behavior.., so gray wasted spaces between figure’s subplots remain as default..

      • Yair Altman July 29, 2012 at 02:28

        @Vladi – the subplot function overrides the default LooseInset value and sets its own ([.13,.11,.095,.047] in normalized units). After the subplots are created you can override their LooseInset and OuterPosition property values to get the desired effect.

  4. sundar August 21, 2012 at 04:51 Reply

    This (set(gca,’LooseInset’,get(gca,’TightInset’))) works well for me in case of plots generated using the plot command. But it does not work for me for figures generated using imshow command.

    Any suggestions?

    Thanks

    • Yair Altman August 21, 2012 at 04:59 Reply

      @Sundar – it does work for imshow, but it is possible that you see no difference and the reason is that imshow preserves the image aspect ratio and other such factors that affect image display in the axes. If you’ll do set(gca,’Visible’,’on’,’Box’,’on’) I think you will see this more clearly. Also, resize the figure window to see the figure axes change its size.

  5. Dims June 9, 2013 at 15:23 Reply

    Both LooseInset and Visible didn’t work for me.

    The following code works samely with and without any sets.

    subplot(5,4,1);
    set(gca, 'LooseInset', [0,0,0,0]);
    set(gca,'Visible','on','Box','on');
    imshow(rgb1);
    subplot(5,4,2);
    set(gca, 'LooseInset', [0,0,0,0]);
    imshow(original1_L);
    subplot(5,4,3);
    set(gca, 'LooseInset', [0,0,0,0]);
    imshow(original1_a);
    subplot(5,4,4);
    set(gca, 'LooseInset', [0,0,0,0]);
    imshow(original1_b);

    subplot(5,4,1); set(gca, 'LooseInset', [0,0,0,0]); set(gca,'Visible','on','Box','on'); imshow(rgb1); subplot(5,4,2); set(gca, 'LooseInset', [0,0,0,0]); imshow(original1_L); subplot(5,4,3); set(gca, 'LooseInset', [0,0,0,0]); imshow(original1_a); subplot(5,4,4); set(gca, 'LooseInset', [0,0,0,0]); imshow(original1_b);

    • Yair Altman June 9, 2013 at 15:38 Reply

      @Dims – LooseInset doesn’t work on subplots, only regular axes; try setting Visible after imshow()

  6. Chris January 21, 2014 at 06:51 Reply

    I’ve noticed that

    set(gca,'LooseInset',get(gca,'TightInset'))

    set(gca,'LooseInset',get(gca,'TightInset'))

    sometimes seems to work best after a short delay following resizing and positioning a subplot. If it doesn’t seem to make much difference when first applied, I use

    pause(0.1)

    pause(0.1)

    set(gca,'LooseInset',get(gca,'TightInset'))

    set(gca,'LooseInset',get(gca,'TightInset'))

    I’m guessing this ensures the plot has been rendered on-screen before the command is applied.

    • Yair Altman January 21, 2014 at 06:52 Reply

      @Chris – I assume that drawnow would be more appropriate than pause in this case

  7. Richard Hodges June 5, 2014 at 11:02 Reply

    If an imagesc in a figure has a colorbar, setting LooseInset to [0 0 0 0] causes the colorbar to be outside the figure, hence not visible. LooseInset can be set to some other value that keeps the colorbar visible, for example [0 0 .1 .01], but if the figure is resized the value of the 3rd element of LooseInset needs to be different. This could possibly be addressed with a resize callback function but I have not been able to figure out how to automatically determine a good value for LooseInset. Anybody have a solution?

    Thanks,
    Richard

  8. Gerald July 9, 2014 at 08:30 Reply

    I’ve noticed that if I use set(gca,'LooseInset',get(gca,'TightInset')) to remove the white space, after I save the figure and reopen the figure the xlabel is cut-off for larger sized figures (1206 x 785 pixels) because MATLAB changes the ActivePositionProperty from 'outerposition' to 'position', and MATLAB also reduces the figure vertical size by 6 pixels. Anybody else run into this?

    • Yair Altman July 9, 2014 at 08:41 Reply

      @Gerald – odd. A possible workaround is to set the figure’s CreateFcn callback property to a function that fixes this. Whenever the figure will then be opened, this callback will execute, fixing this (and any other) oddity. I use this trick to recreate toolbar customizations that would otherwise get lost across figure save/load.

  9. Fasil December 31, 2015 at 05:07 Reply

    Thanks a lot.

  10. Nate May 25, 2016 at 20:16 Reply

    Like others, I’m struggling to use this to get rid of white space in subplots. Perhaps an example would help? And is it best to resize the figure before apply this commands?

    Many thanks,

  11. Make MATLAB Plots fill the whole window – zachlge.org November 14, 2016 at 10:51 Reply

    […] And voila, your plot should fill the whole window without creating much whitespace, which is perfectly fine for exporting plots for documentations. You can also check out some more propertys at http://undocumentedmatlab.com/blog/axes-looseinset-property […]

  12. Johnny March 9, 2017 at 12:28 Reply

    Thanks a million, super useful

  13. ss June 5, 2017 at 10:29 Reply

    It doesn’t work when axes in uipanel?
    Why?

Leave a Reply
HTML tags such as <b> or <i> are accepted.
Wrap code fragments inside <pre lang="matlab"> tags, like this:
<pre lang="matlab">
a = magic(3);
disp(sum(a))
</pre>
I reserve the right to edit/delete comments (read the site policies).
Not all comments will be answered. You can always email me (altmany at gmail) for private consulting.

Click here to cancel reply.

Useful links
  •  Email Yair Altman
  •  Subscribe to new posts (feed)
  •  Subscribe to new posts (reader)
  •  Subscribe to comments (feed)
 
Accelerating MATLAB Performance book
Recent Posts

Speeding-up builtin Matlab functions – part 3

Improving graphics interactivity

Interesting Matlab puzzle – analysis

Interesting Matlab puzzle

Undocumented plot marker types

Matlab toolstrip – part 9 (popup figures)

Matlab toolstrip – part 8 (galleries)

Matlab toolstrip – part 7 (selection controls)

Matlab toolstrip – part 6 (complex controls)

Matlab toolstrip – part 5 (icons)

Matlab toolstrip – part 4 (control customization)

Reverting axes controls in figure toolbar

Matlab toolstrip – part 3 (basic customization)

Matlab toolstrip – part 2 (ToolGroup App)

Matlab toolstrip – part 1

Categories
  • Desktop (45)
  • Figure window (59)
  • Guest bloggers (65)
  • GUI (165)
  • Handle graphics (84)
  • Hidden property (42)
  • Icons (15)
  • Java (174)
  • Listeners (22)
  • Memory (16)
  • Mex (13)
  • Presumed future risk (394)
    • High risk of breaking in future versions (100)
    • Low risk of breaking in future versions (160)
    • Medium risk of breaking in future versions (136)
  • Public presentation (6)
  • Semi-documented feature (10)
  • Semi-documented function (35)
  • Stock Matlab function (140)
  • Toolbox (10)
  • UI controls (52)
  • Uncategorized (13)
  • Undocumented feature (217)
  • Undocumented function (37)
Tags
AppDesigner (9) Callbacks (31) Compiler (10) Desktop (38) Donn Shull (10) Editor (8) Figure (19) FindJObj (27) GUI (141) GUIDE (8) Handle graphics (78) HG2 (34) Hidden property (51) HTML (26) Icons (9) Internal component (39) Java (178) JavaFrame (20) JIDE (19) JMI (8) Listener (17) Malcolm Lidierth (8) MCOS (11) Memory (13) Menubar (9) Mex (14) Optical illusion (11) Performance (78) Profiler (9) Pure Matlab (187) schema (7) schema.class (8) schema.prop (18) Semi-documented feature (6) Semi-documented function (33) Toolbar (14) Toolstrip (13) uicontrol (37) uifigure (8) UIInspect (12) uitable (6) uitools (20) Undocumented feature (187) Undocumented function (37) Undocumented property (20)
Recent Comments
Contact us
Captcha image for Custom Contact Forms plugin. You must type the numbers shown in the image
Undocumented Matlab © 2009 - Yair Altman
This website and Octahedron Ltd. are not affiliated with The MathWorks Inc.; MATLAB® is a registered trademark of The MathWorks Inc.
Scroll to top