Undocumented Matlab
  • SERVICES
    • Consulting
    • Development
    • Training
    • Gallery
    • Testimonials
  • PRODUCTS
    • IQML: IQFeed-Matlab connector
    • IB-Matlab: InteractiveBrokers-Matlab connector
    • EODML: EODHistoricalData-Matlab connector
    • Webinars
  • BOOKS
    • Secrets of MATLAB-Java Programming
    • Accelerating MATLAB Performance
    • MATLAB Succinctly
  • ARTICLES
  • ABOUT
    • Policies
  • CONTACT

Undocumented Profiler options part 3

September 26, 2012 4 Comments

Today’s article continues my series on undocumented features of the Matlab Profiler. Past articles explained how to profile memory, improve timing resolution and fix a font issue. Today’s article will explain undocumented switches of the profile function that can be used to provide detailed history timeline of the function calls. Next week’s article will conclude the series by explaining undocumented switches of the profile function that can be used to profile built-in functions, to report and remove the profiling overhead, plus a couple of as-yet-unsolved mysteries.

Simple call history

One of the features that the programmatic profiling interface provides, and which is not represented in the Profiler GUI, is a report of the exact order in which different functions were called during the profiling session. This profiling history can be turned on using the –history switch. There is also an optional switch of –historysize, which enables us to modify the history size from a default maximum of 1 million function entry and exit items. Here is a sample usage of this history feature:

>> profile('on','-history'); surf(peaks); profile('off')
>> profData = profile('info');
>> history = profData.FunctionHistory
history =
  Columns 1 through 11
     0     0     0     1     0     1     0     1     1     1     0
    19     1    17    17    17    17    18    18     1    19     5
  ...

>> profile('on','-history'); surf(peaks); profile('off') >> profData = profile('info'); >> history = profData.FunctionHistory history = Columns 1 through 11 0 0 0 1 0 1 0 1 1 1 0 19 1 17 17 17 17 18 18 1 19 5 ...

The history data is actually a numeric matrix, where the first row contains the values 0 (=function entry) or 1 (=function exit), and the second row is the corresponding index into profData.FunctionTable, indicating the called function. We can easily convert this matrix into human-readable form using the following code snippet:

offset = cumsum(1-2*history(1,:)) - 1;  % calling depth
entryIdx = history(1,:)==1;     % history items of function entries
funcIdx = history(2,entryIdx);  % indexes of relevant functions
funcNames = {profData.FunctionTable(funcIdx).FunctionName};
for idx = 1: length(funcNames);
   disp([repmat(' ',1,offset(idx)) funcNames{idx}]);
end

offset = cumsum(1-2*history(1,:)) - 1; % calling depth entryIdx = history(1,:)==1; % history items of function entries funcIdx = history(2,entryIdx); % indexes of relevant functions funcNames = {profData.FunctionTable(funcIdx).FunctionName}; for idx = 1: length(funcNames); disp([repmat(' ',1,offset(idx)) funcNames{idx}]); end

which generates the following calling list in the MATLAB Command Window:

isempty
 isempty
  transpose
 meshgrid
  peaks
 nargchk
  error
 ishg2parent
...

isempty isempty transpose meshgrid peaks nargchk error ishg2parent ...

Unfortunately, the history information does not by default contain specific timing of each function entry/exit, but we can still make good use of it by looking at the sequence in which the functions were called from each other.

Detailed call history, with timing information

In order to retrieve actual history timing information, we can run profile with the undocumented/unsupported –timestamp switch, which stores the CPU clock next to the history information. The reported history matrix now has 4 rows rather than 2, where the extra rows represents the timestamp of each function entry/exit:

>> profile('on','-timestamp'); surf(peaks); profile('off')
>> profData = profile('info');
>> profData.FunctionHistory(:,1:3)
ans =
                0                0                1
                1                2                2
       1347473710       1347473710       1347473710
           453000           453000           468000

>> profile('on','-timestamp'); surf(peaks); profile('off') >> profData = profile('info'); >> profData.FunctionHistory(:,1:3) ans = 0 0 1 1 2 2 1347473710 1347473710 1347473710 453000 453000 468000

In this report, the 3rd row represents the timestamp in seconds, while the 4th row represents the fractional portion of the timestamp, in microseconds. In the example above, the first timestamp item corresponds to 1347473710.453 seconds.
The seconds value appears to be related to the number of seconds since midnight Jan 1, 1970 (so-called Epoch), which is a standard time representation in computing systems. However, the actual value appears to be off by slightly over a day from the expected value (which is retrievable via getTime(java.util.Date)) for some unknown reason. Since we are only interested in relative, rather than absolute times when profiling, this minor difference does not affect us.
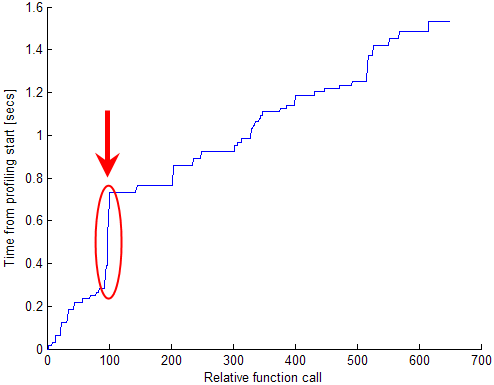
The timeline of the profiling session can be visualized as follows:

histData = profData.FunctionHistory;
startTime     = histData(3,1) + histData(4,1)/1e6;
relativeTimes = histData(3,:) + histData(4,:)/1e6 - startTime;
plot(relativeTimes);

histData = profData.FunctionHistory; startTime = histData(3,1) + histData(4,1)/1e6; relativeTimes = histData(3,:) + histData(4,:)/1e6 - startTime; plot(relativeTimes);

Profiling history timeline

This report helps us see that a particular set of function calls, around the 100th call mark, is responsible for about 0.5 seconds, a prime candidate for tuning investigation. If we only relied on the standard profiling report we might have missed this because it might have been meshed into the same “bucket” as other invocations of the same function. As illustration, take the following simulated example:

Invocation  #1 of func():  0.500 secs
Invocation  #2 of func():  0.013 secs
Invocation  #3 of func():  0.011 secs
   ...
Invocation #10 of func():  0.012 secs
_____________________________________
Total invocation time:     0.600 secs

Invocation #1 of func(): 0.500 secs Invocation #2 of func(): 0.013 secs Invocation #3 of func(): 0.011 secs ... Invocation #10 of func(): 0.012 secs _____________________________________ Total invocation time: 0.600 secs

In this simulation, we would not have known that the 0.6 secs invocation time of func() is not really evenly distributed across all 10 invocations, and this would lead us to incorrect conclusions. For example, we could spend time unnecessarily on tuning the steady-state run-time performance of the function, whereas we should really have concentrated on only the first invocation. By looking at the actual timestamps we could see the large run-time used by the first invocation and this information can possibly be used to tune this first invocation and significantly reduce the overall time taken by the function.
Note: instead of using profile -timestamp, we could also have used the undocumented built-in function callstats, which is the underlying profiling engine (the profile function is simply a convenient wrapper function to callstats – take a look within profile.m):

callstats('history',2);  % 0 = -nohistory, 1 = -history, 2 = -timestamp

callstats('history',2); % 0 = -nohistory, 1 = -history, 2 = -timestamp

History collection has an overhead, so if you don’t need it then you should turn it off:

profile -nohistory
profile('-nohistory')    % equivalent alternative
callstats('history',0);  % equivalent alternative

profile -nohistory profile('-nohistory') % equivalent alternative callstats('history',0); % equivalent alternative

Addendum (June 16th, 2014): I have created a utility (profile_history, available on the Matlab File Exchange) that parses all this profile data and presents it in an interactive GUI. See this article for details.
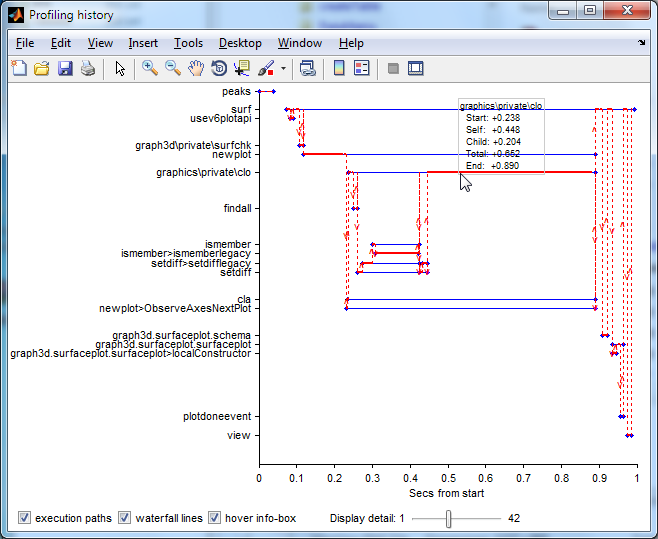
Function call timeline profiling (click for full-size image)

Related posts:

  1. Undocumented Profiler options part 4 – Several undocumented features of the Matlab Profiler can make it much more useful - part 4 of series. ...
  2. Undocumented profiler options – The Matlab profiler has some undocumented options that facilitate debugging memory bottlenecks and JIT (Just-In-Time Java compilation) problems....
  3. Undocumented Profiler options part 2 – Several undocumented features of the Matlab Profiler can make it much more useful - part 2 of series. ...
  4. Buggy Profiler option – a bug exists in the profiler that prevents usage of its documented CPU timing functionality. ...
  5. Function call timeline profiling – A new utility enables to interactively explore Matlab function call timeline profiling. ...
  6. uiundo – Matlab's undocumented undo/redo manager – The built-in uiundo function provides easy yet undocumented access to Matlab's powerful undo/redo functionality. This article explains its usage....
callstats Performance Profiler Pure Matlab
Print Print
« Previous
Next »
4 Responses
  1. Function call timeline profiling | Undocumented Matlab June 16, 2014 at 14:36 Reply

    […] Back in 2012, I wrote an article about the Matlab profiler’s undocumented functionality of storing detailed information […]

  2. juli November 2, 2017 at 10:53 Reply

    hello,

    I tried this code with an very large project I have and regarding the code:

    offset = cumsum(1-2*history(1,:)) - 1;  % calling depth
    entryIdx = history(1,:)==1;     % history items of function entries
    funcIdx = history(2,entryIdx);  % indexes of relevant functions
    funcNames = {profData.FunctionTable(funcIdx).FunctionName};
    for idx = 1: length(funcNames);
       disp([repmat(' ',1,offset(idx)) funcNames{idx}]);
    end

    offset = cumsum(1-2*history(1,:)) - 1; % calling depth entryIdx = history(1,:)==1; % history items of function entries funcIdx = history(2,entryIdx); % indexes of relevant functions funcNames = {profData.FunctionTable(funcIdx).FunctionName}; for idx = 1: length(funcNames); disp([repmat(' ',1,offset(idx)) funcNames{idx}]); end

    for some reason the line funcNames = {profData.FunctionTable(funcIdx).FunctionName}; is extremely slow and this workaround is faster:

    for idx = 1:length(funcIdx);
        fprintf([repmat(' ',1,offset(idx)) profData.FunctionTable(funcIdx(idx)).FunctionName 'n']);
    end

    for idx = 1:length(funcIdx); fprintf([repmat(' ',1,offset(idx)) profData.FunctionTable(funcIdx(idx)).FunctionName 'n']); end

    • Yair Altman November 2, 2017 at 11:42 Reply

      @Juli – thanks for sharing. Read my followup post about the profile_history utility.

  3. juli November 3, 2017 at 10:09 Reply

    hi Yair,

    thanks I have readed and tried but in my case the code evaluated has 156 levels and is very slow to represent the figure and to see the diferent levels.

    regards,
    j

Leave a Reply
HTML tags such as <b> or <i> are accepted.
Wrap code fragments inside <pre lang="matlab"> tags, like this:
<pre lang="matlab">
a = magic(3);
disp(sum(a))
</pre>
I reserve the right to edit/delete comments (read the site policies).
Not all comments will be answered. You can always email me (altmany at gmail) for private consulting.

Click here to cancel reply.

Useful links
  •  Email Yair Altman
  •  Subscribe to new posts (feed)
  •  Subscribe to new posts (reader)
  •  Subscribe to comments (feed)
 
Accelerating MATLAB Performance book
Recent Posts

Speeding-up builtin Matlab functions – part 3

Improving graphics interactivity

Interesting Matlab puzzle – analysis

Interesting Matlab puzzle

Undocumented plot marker types

Matlab toolstrip – part 9 (popup figures)

Matlab toolstrip – part 8 (galleries)

Matlab toolstrip – part 7 (selection controls)

Matlab toolstrip – part 6 (complex controls)

Matlab toolstrip – part 5 (icons)

Matlab toolstrip – part 4 (control customization)

Reverting axes controls in figure toolbar

Matlab toolstrip – part 3 (basic customization)

Matlab toolstrip – part 2 (ToolGroup App)

Matlab toolstrip – part 1

Categories
  • Desktop (45)
  • Figure window (59)
  • Guest bloggers (65)
  • GUI (165)
  • Handle graphics (84)
  • Hidden property (42)
  • Icons (15)
  • Java (174)
  • Listeners (22)
  • Memory (16)
  • Mex (13)
  • Presumed future risk (394)
    • High risk of breaking in future versions (100)
    • Low risk of breaking in future versions (160)
    • Medium risk of breaking in future versions (136)
  • Public presentation (6)
  • Semi-documented feature (10)
  • Semi-documented function (35)
  • Stock Matlab function (140)
  • Toolbox (10)
  • UI controls (52)
  • Uncategorized (13)
  • Undocumented feature (217)
  • Undocumented function (37)
Tags
AppDesigner (9) Callbacks (31) Compiler (10) Desktop (38) Donn Shull (10) Editor (8) Figure (19) FindJObj (27) GUI (141) GUIDE (8) Handle graphics (78) HG2 (34) Hidden property (51) HTML (26) Icons (9) Internal component (39) Java (178) JavaFrame (20) JIDE (19) JMI (8) Listener (17) Malcolm Lidierth (8) MCOS (11) Memory (13) Menubar (9) Mex (14) Optical illusion (11) Performance (78) Profiler (9) Pure Matlab (187) schema (7) schema.class (8) schema.prop (18) Semi-documented feature (6) Semi-documented function (33) Toolbar (14) Toolstrip (13) uicontrol (37) uifigure (8) UIInspect (12) uitable (6) uitools (20) Undocumented feature (187) Undocumented function (37) Undocumented property (20)
Recent Comments
Contact us
Captcha image for Custom Contact Forms plugin. You must type the numbers shown in the image
Undocumented Matlab © 2009 - Yair Altman
This website and Octahedron Ltd. are not affiliated with The MathWorks Inc.; MATLAB® is a registered trademark of The MathWorks Inc.
Scroll to top