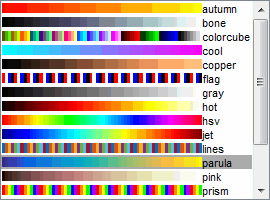
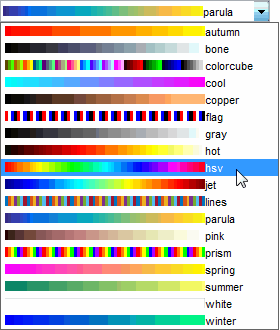
One of my consulting clients recently asked me if I knew any builtin Matlab GUI control that could display a list of colormap names alongside their respective image icons, in a listbox or popup menu (drop-down/combo-box):


My initial thought was that this should surely be possible, since Colormap is a documented figure property, that should therefore be listed inside the inspector window, and should therefore have an associated builtin Java control for the dropdown (just like other inspector controls, which are part of the
com.mathworks.mlwidgets package, or possibly as a standalone control in the com.mathworks.mwswing package). To my surprise it turns out that for some unknown reason MathWorks neglected to add the Colormap property (and associated Java controls) to the inspector. This property is fully documented and all, just like Color and other standard figure properties, but unlike them Colormap can only be modified programmatically, not via the inspector window. Matlab does provide the related colormapeditor function and associated dialog window, but I would have expected a simple drop-down of the standard builtin colormaps to be available in the inspector. Anyway, this turned out to be a dead-end.It turns out that we can relatively easily implement the requested listbox/combo-box using a bit of HTML magic, as I explained last week. The basic idea is for each of the listbox/combobox items to be an HTML string that contains both an <img> tag for the icon and the item label text. For example, such a string might contain something like this (parula is Matlab’s default colormap in HG2, starting in R2014b):
<html><img src="http://www.mathworks.com/help/matlab/ref/colormap_parula.png">parula |

Of course, it would be a bit inefficient for each of the icons to be fetched from the internet. Luckily, the full set of Matlab documentation is typically installed on the local computer as part of the standard Matlab installation, beneath the docroot folder (e.g., C:\Program Files\Matlab\R2016b\help). In our specific case, the parula colormap image is located in:
imageFilename = [docroot, '/matlab/ref/colormap_parula.png'] |
Note that for a local image to be accepted by HTML, it needs to follow certain conventions. In our case, the HTML string for displaying the above image is:
<html><img src="file:///C:/Program%20Files/Matlab/R2016b/help/matlab/ref/colormap_parula.png">parula |
Warning: it’s easy when dealing with HTML images in Matlab to get the format confused, resulting in a red-x icon. I discussed this issue some 4 years ago, which is still relevant.
How can we get the list of available builtin colormaps? The standard Matlab way of doing this would be something like this:
>> possibleColormaps = set(gcf,'Colormap') possibleColormaps = {} |
but as we can see, for some unknown reason (probably another MathWorks omission), Matlab does not list the names of its available builtin colormaps.
Fortunately, all the builtin colormaps have image filenames that follow the same convention, which make it easy to get this list by simply listing the names of the relevant files, from which we can easily create the necessary HTML strings:
>> iconFiles = dir([docroot, '/matlab/ref/colormap_*.png']); >> colormapNames = regexprep({iconFiles.name}, '.*_(.*).png', '$1') colormapNames = Columns 1 through 9 'autumn' 'bone' 'colorcube' 'cool' 'copper' 'flag' 'gray' 'hot' 'hsv' Columns 10 through 18 'jet' 'lines' 'parula' 'pink' 'prism' 'spring' 'summer' 'white' 'winter' >> htmlStrings = strcat('<html><img width=200 height=10 src="file:///C:/Program%20Files/Matlab/R2016a/help/matlab/ref/colormap_', colormapNames', '.png">', colormapNames') str = '<html><img width=200 height=10 src="file:///C:/Program%20Files/Matlab/R2016a/help/matlab/ref/colormap_autumn.png">autumn' '<html><img width=200 height=10 src="file:///C:/Program%20Files/Matlab/R2016a/help/matlab/ref/colormap_bone.png">bone' '<html><img width=200 height=10 src="file:///C:/Program%20Files/Matlab/R2016a/help/matlab/ref/colormap_colorcube.png">colorcube' ... >> hListbox = uicontrol(gcf, 'Style','listbox', 'Units','pixel', 'Pos',[10,10,270,200], 'String',htmlStrings); >> hPopup = uicontrol(gcf, 'Style','popup', 'Units','pixel', 'Pos',[10,500,270,20], 'String',htmlStrings); |
…which results in the screenshots at the top of this post.
Note how I scaled the images to 10px high (so that the labels would be shown and not cropped vertically) and 200px wide (so that it becomes narrower than the default 434px). There’s really no need in this case for the full 434×27 image size – such flat images scale very nicely, even when their aspect ratio is not preserved. You can adjust the height and width values for a best fit with you GUI.
Unfortunately, it seems that HTML strings are not supported in the new web-based uifigure controls. This is not really Matlab’s fault because the way to customize labels in HTML controls is via CSS: directly embedding HTML code in labels does not work (it’s a Java-Swing feature, not a browser feature). I really hope that either HTML or CSS processing will be enabled for web-based uicontrol in a future Matlab release, because until that time uifigure uicontrols will remain seriously deficient compared to standard figure uicontrols. Until then, if we must use uifigures and wish to customize our labels or listbox items, we can directly access the underlying web controls, as Iliya explained here.
A blog reader recently complained that I’m abusing Swing and basically making Matlab work in unnatural ways, “something it was never meant to be“. I feel that using HTML as I’ve shown last week and in this post would fall under the same category in his eyes. To him and to others who complain I say that I have absolutely no remorse about doing this. When I purchase anything I have the full rights (within the scope of the license) to adapt it in whatever way fits my needs. As a software developer and manager for over 25 years, I’ve developed in dozens of programming languages and environments, and I still enjoy [ab]using Matlab. Matlab is a great environment to get things done quickly and if this sometimes requires a bit of HTML or Java hacks that make some people cringe, then that’s their problem, not mine – I’m content with being able to do in Matlab [nearly] everything I want, quickly, and move on to the next project. As long as it gets the job done, that’s fine by me. If this makes me more of an engineer than a computer scientist, then so be it.
On the flip side, I say to those who claim that Matlab is lacking in this or that aspect, that in most likelihood the limitation is only in their minds, not in Matlab – we can do amazing stuff with Matlab if we just open our minds, and possibly use some undocumented hacks. I’m not saying that Matlab has no limitations, I’m just saying that in most cases they can be overcome if we took the time and trouble to look for a solution. Matlab is a great tool and yet many people are not aware of its potential. Blaming Matlab for its failings is just an easy excuse in many cases. Of course, MathWorks could help my crusade on this subject by enabling useful features such as easy GUI component customizations…
On this sad day, I wish you all Shanah Tova!


Hi Yair,
Could you dedicate a post about using `image()` and `imagesc()` an assuring 1:1 (100%) zoom level of an image?
I know there is `imshow()` but what if one would like to use low level functions.
Moreover, since the ‘Unit’ ‘pixel’ isn’t a pixel anymore, it might be tricky.
Thank You.
Shanah Tova!
Hello Yair
One possible solution to get the list of builtin colormaps would be to parse in R2016b the functionSignatures.json under matlabroot\toolbox\matlab\graph3d and to use loadjson from https://www.mathworks.com/matlabcentral/fileexchange/33381-jsonlab–a-toolbox-to-encode-decode-json-files
which would return
It was just a sidenote 😉
With R2016b, you can use built-in function jsondecode.
Oddly enough, some .json files in matlabroot are not valid JSON files: some contain comments and others have duplicate keys.
I plan an extensive exposé on functionSignatures.json in the upcoming weeks. Stay tuned 🙂
To be truthful, I have it in the works for several months already. But with R2016b officially out, and you having outed these files, it’s about time for me to close this corner. This is a great feature that is still undocumented, so it’s a perfect match for this blog.
Excellent decision Yair !
Thanks!
Hi Yair,
We can adjust the width and height of the image e.g. (‘autumn’)
Is there a way to show a part (selected coords only) of an image on uicontrols using html code?
Thanks
Ozgu