Undocumented Matlab
  • SERVICES
    • Consulting
    • Development
    • Training
    • Gallery
    • Testimonials
  • PRODUCTS
    • IQML: IQFeed-Matlab connector
    • IB-Matlab: InteractiveBrokers-Matlab connector
    • EODML: EODHistoricalData-Matlab connector
    • Webinars
  • BOOKS
    • Secrets of MATLAB-Java Programming
    • Accelerating MATLAB Performance
    • MATLAB Succinctly
  • ARTICLES
  • ABOUT
    • Policies
  • CONTACT

Undocumented scatter plot jitter

June 6, 2012 4 Comments

Yesterday I started presenting a multi-day Matlab training course for some client. As I was preparing the data visualization segment, I planned to show a programmatic implementation of scatterplot jitter when I came across an undocumented built-in implementation of exactly this mechanism, that I will describe today.

The problem with standard scatter plots

In a scatter plot, we cannot easily minor value differences, when the data points overlap each other. For example:

% Prepare the data
groupX = ones(1,100) * 30;
groupY = ones(1,100) * 24;
singletonsX = [20,40];
singletonsY = [18,32];
dataX = [groupX,singletonsX];
dataY = [groupY,singletonsY];
% Display in a scatterplot
scatter(dataX, dataY);
xlim([0,50]);
ylim([0,40]);

% Prepare the data groupX = ones(1,100) * 30; groupY = ones(1,100) * 24; singletonsX = [20,40]; singletonsY = [18,32]; dataX = [groupX,singletonsX]; dataY = [groupY,singletonsY]; % Display in a scatterplot scatter(dataX, dataY); xlim([0,50]); ylim([0,40]);

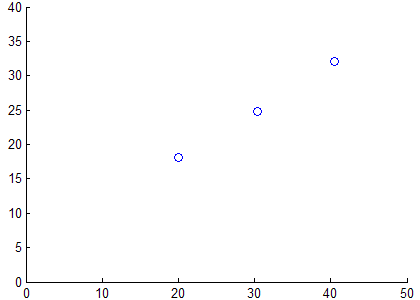
Standard scatter plot - cannot see distribution density

Both data points look exactly the same and no amount of zooming-in will discover that there are 100 data points in the center data point compared to only a single data point in the top-right and lower-left. When we wish to visually convey density distributions of real values this could lead to erroneous assumptions about the data.

The solution: jitter the data

The solution that is generally used in such cases is to either use some other plot type to convey the density information (e.g., histograms, CDF or quantile plots), or to keep using scatter plots but jitter the data just a tiny bit that would enable users to visualize the density more clearly. Jittering the data introduces minor inaccuracies to the data, which some may find anathema, but it does solve the visualization problem:

jitterAmount = 0.5;
jitterValuesX = 2*(rand(size(dataX))-0.5)*jitterAmount;   % +/-jitterAmount max
jitterValuesY = 2*(rand(size(dataY))-0.5)*jitterAmount;   % +/-jitterAmount max
scatter(dataX+jitterValuesX, dataY+jitterValuesY);

jitterAmount = 0.5; jitterValuesX = 2*(rand(size(dataX))-0.5)*jitterAmount; % +/-jitterAmount max jitterValuesY = 2*(rand(size(dataY))-0.5)*jitterAmount; % +/-jitterAmount max scatter(dataX+jitterValuesX, dataY+jitterValuesY);

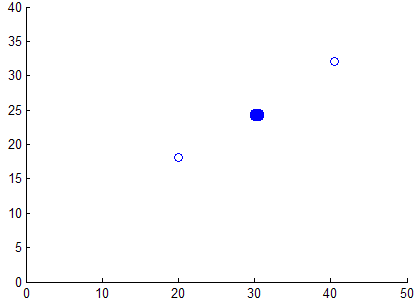
Scatter plot with Jittered data - distribution density evident

Much better, don’t you think?

Matlab’s built-in jitter

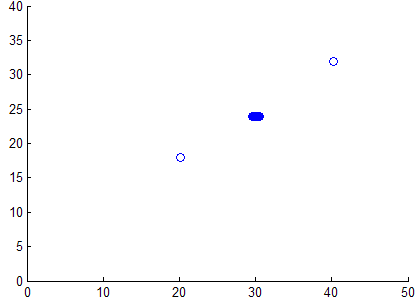
Interestingly, Matlab’s scatterplot has this mechanism built-in, using the undocumented hidden properties Jitter (default=’off’) and JitterAmount (default=0.2). Note that JitterAmount is an absolute (not relative) value, just as in my example above. Also, the built-in jitter only applies to the X data and does not jitter the Y values. Jitter is also applied only to 2D (not 3D) scatter plots:

scatter(dataX, dataY, 'jitter','on', 'jitterAmount',0.5);

scatter(dataX, dataY, 'jitter','on', 'jitterAmount',0.5);

Scatter plot with Jittered X-data

This built-in Jitter functionality has existed all the way back to Matlab 7.1 (2005), and possibly earlier. I know it did not exist in Matlab 6.0; I am unsure regarding releases 6.5 and 7.0. In any case, as far as undocumented functionality goes, this one is pretty ancient.

Customizing Matlab’s jitter

The jitter implementation is provided in %matlabroot%/toolbox/matlab/specgraph/@specgraph/@scattergroup/refresh.m lines 16-18 (in R2012a):

if ~is3D && strcmp(this.Jitter,'on')
   x = x + (rand(size(x))-0.5)*(2*this.JitterAmount);
end

if ~is3D && strcmp(this.Jitter,'on') x = x + (rand(size(x))-0.5)*(2*this.JitterAmount); end

As you can see, it is trivially easy to modify this code to include Y-data jitter, or to make JitterAmount a relative rather than an absolute value. If you wish to use separate JitterAmounts for X and Y, change the definition of JitterAmount from ‘double’ to ”MATLAB array’ in %matlabroot%/toolbox/matlab/specgraph/@specgraph/@scattergroup/schema.m line 43:

hProp = schema.prop(hClass, 'Jitter', 'on/off');
hProp.Description = 'Enable/disable jittering';
hProp.FactoryValue = 'off';
hProp.Visible = 'off';
markDirtyProp = Lappend(markDirtyProp,hProp);
hProp = schema.prop(hClass, 'JitterAmount', 'double');    % Change this, 'double' => 'MATLAB Array'
hProp.Description = 'Maximum amount of jitter';
hProp.FactoryValue = .2;
hProp.Visible = 'off';
markDirtyProp = Lappend(markDirtyProp,hProp);

hProp = schema.prop(hClass, 'Jitter', 'on/off'); hProp.Description = 'Enable/disable jittering'; hProp.FactoryValue = 'off'; hProp.Visible = 'off'; markDirtyProp = Lappend(markDirtyProp,hProp); hProp = schema.prop(hClass, 'JitterAmount', 'double'); % Change this, 'double' => 'MATLAB Array' hProp.Description = 'Maximum amount of jitter'; hProp.FactoryValue = .2; hProp.Visible = 'off'; markDirtyProp = Lappend(markDirtyProp,hProp);

Other hidden properties of scatterplots

For the record, here is a list of the other hidden properties of scatterplot. This list can be retrieved using my getundoc utility:

>> hggroup = scatter(dataX, dataY);
>> getundoc(hggroup)
ans =
        ALimInclude: 'on'
    ApplicationData: [1x1 struct]
           Behavior: [1x1 struct]
        CLimInclude: 'on'
              Dirty: 'clean'
          EraseMode: 'normal'
       HelpTopicKey: ''
    IncludeRenderer: 'on'
        Initialized: 1
             Jitter: 'on'
       JitterAmount: 0.51
        PixelBounds: [0 0 0 0]
        RefreshMode: 'auto'
       Serializable: 'on'
        XLimInclude: 'on'
        YLimInclude: 'on'
        ZLimInclude: 'on'

>> hggroup = scatter(dataX, dataY); >> getundoc(hggroup) ans = ALimInclude: 'on' ApplicationData: [1x1 struct] Behavior: [1x1 struct] CLimInclude: 'on' Dirty: 'clean' EraseMode: 'normal' HelpTopicKey: '' IncludeRenderer: 'on' Initialized: 1 Jitter: 'on' JitterAmount: 0.51 PixelBounds: [0 0 0 0] RefreshMode: 'auto' Serializable: 'on' XLimInclude: 'on' YLimInclude: 'on' ZLimInclude: 'on'

Of these properties, the following are unique to scatter plots: Dirty, Initialized, Jitter, JitterAmount, RefreshMode. The rest are common to all Handle Graphic objects.
You may also be interested in the article I posted a few years ago about another undocumented scatterplot behavior.

Related posts:

  1. Undocumented scatter plot behavior – The scatter plot function has an undocumented behavior when plotting more than 100 points: it returns a single unified patch object handle, rather than a patch handle for each specific point as it returns with 100 or less points....
  2. Undocumented plot marker types – Undocumented plot marker styles can easily be accesses using a hidden plot-line property. ...
  3. Accessing hidden HG2 plot functionality – In HG2, some of the plot functionality is hidden in undocumented properties. ...
  4. Accessing plot brushed data – Plot data brushing can be accessed programmatically using very simple pure-Matlab code...
  5. Performance: scatter vs. line – In many circumstances, the line function can generate visually-identical plots as the scatter function, much faster...
  6. Plot LimInclude properties – The plot objects' XLimInclude, YLimInclude, ZLimInclude, ALimInclude and CLimInclude properties are an important feature, that has both functional and performance implications....
Handle graphics Hidden property Pure Matlab Undocumented feature
Print Print
« Previous
Next »
4 Responses
  1. the cyclist June 6, 2012 at 07:28 Reply

    I suspect that the reason the jitter is only in the X direction is that jitter is a (documented) feature for the boxplot command, where the points beyond the whisker can be jittered side-to-side.

  2. Felix November 8, 2012 at 09:50 Reply

    Its a pitty, there is no jitter propterty for the “errorbars” plot, becuse I want to create a scatterplot consisting of mean data points.

  3. Jake February 23, 2018 at 04:50 Reply

    Any ideas of how to use this jitter functionality with gscatter?

    • Yair Altman February 24, 2018 at 19:55 Reply

      @Jake – gscatter creates line objects, which do not have Jitter properties as in scatter objects. If you want to use the jitter functionality, use scatter rather than gscatter.

Leave a Reply
HTML tags such as <b> or <i> are accepted.
Wrap code fragments inside <pre lang="matlab"> tags, like this:
<pre lang="matlab">
a = magic(3);
disp(sum(a))
</pre>
I reserve the right to edit/delete comments (read the site policies).
Not all comments will be answered. You can always email me (altmany at gmail) for private consulting.

Click here to cancel reply.

Useful links
  •  Email Yair Altman
  •  Subscribe to new posts (feed)
  •  Subscribe to new posts (reader)
  •  Subscribe to comments (feed)
 
Accelerating MATLAB Performance book
Recent Posts

Speeding-up builtin Matlab functions – part 3

Improving graphics interactivity

Interesting Matlab puzzle – analysis

Interesting Matlab puzzle

Undocumented plot marker types

Matlab toolstrip – part 9 (popup figures)

Matlab toolstrip – part 8 (galleries)

Matlab toolstrip – part 7 (selection controls)

Matlab toolstrip – part 6 (complex controls)

Matlab toolstrip – part 5 (icons)

Matlab toolstrip – part 4 (control customization)

Reverting axes controls in figure toolbar

Matlab toolstrip – part 3 (basic customization)

Matlab toolstrip – part 2 (ToolGroup App)

Matlab toolstrip – part 1

Categories
  • Desktop (45)
  • Figure window (59)
  • Guest bloggers (65)
  • GUI (165)
  • Handle graphics (84)
  • Hidden property (42)
  • Icons (15)
  • Java (174)
  • Listeners (22)
  • Memory (16)
  • Mex (13)
  • Presumed future risk (394)
    • High risk of breaking in future versions (100)
    • Low risk of breaking in future versions (160)
    • Medium risk of breaking in future versions (136)
  • Public presentation (6)
  • Semi-documented feature (10)
  • Semi-documented function (35)
  • Stock Matlab function (140)
  • Toolbox (10)
  • UI controls (52)
  • Uncategorized (13)
  • Undocumented feature (217)
  • Undocumented function (37)
Tags
AppDesigner (9) Callbacks (31) Compiler (10) Desktop (38) Donn Shull (10) Editor (8) Figure (19) FindJObj (27) GUI (141) GUIDE (8) Handle graphics (78) HG2 (34) Hidden property (51) HTML (26) Icons (9) Internal component (39) Java (178) JavaFrame (20) JIDE (19) JMI (8) Listener (17) Malcolm Lidierth (8) MCOS (11) Memory (13) Menubar (9) Mex (14) Optical illusion (11) Performance (78) Profiler (9) Pure Matlab (187) schema (7) schema.class (8) schema.prop (18) Semi-documented feature (6) Semi-documented function (33) Toolbar (14) Toolstrip (13) uicontrol (37) uifigure (8) UIInspect (12) uitable (6) uitools (20) Undocumented feature (187) Undocumented function (37) Undocumented property (20)
Recent Comments
Contact us
Captcha image for Custom Contact Forms plugin. You must type the numbers shown in the image
Undocumented Matlab © 2009 - Yair Altman
This website and Octahedron Ltd. are not affiliated with The MathWorks Inc.; MATLAB® is a registered trademark of The MathWorks Inc.
Scroll to top